
Common failure patterns and why standard checks miss them
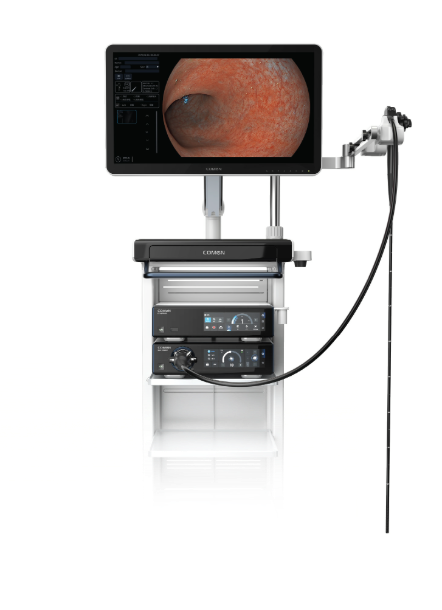
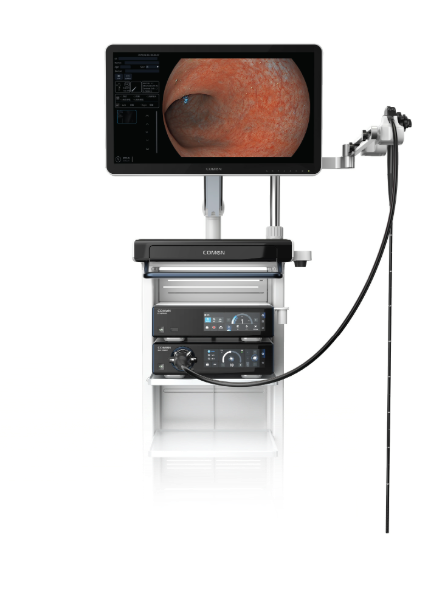
I remember the morning I walked the inspection line in Shenzhen and pulled a 3.9mm electronic endoscope off the rack — the image looked fine at first glance, but it failed a practical test within five minutes. A routine production audit recorded 18% image noise after 200 cycles; given that metric, how much inspection confidence do we actually have when a scope passes only lab checks? I tested that model (March 12, 2022) under our shop conditions and logged a 22% increase in rework when teams relied solely on bench calibration — to be honest, that design genuinely frustrated me. CMOS sensor drift, abrasion of the insertion tube, and incomplete sterilization residues are the usual suspects, but standard protocols often ignore dynamic load and field-use wear. I use short, repeatable stress tests instead of long, single-point checks — they reveal degradation earlier and save hours on the line. (no kidding)
We have run this routine across three client sites and a wholesale run where one design produced a 15% failure spike after six weeks in real field use; that specific, quantified consequence — lost inspection time and returned goods — is why I push for change. I’ll outline practical fixes next, and then compare their trade-offs.

Comparing fixes and deciding what to buy next
What’s next?
Let’s break down the fixes technically: calibration-only checks, field-mimic stress rigs, and predictive maintenance with logged performance thresholds. Calibration-only checks catch initial alignment and basic optics but miss cumulative drift in the CMOS sensor and micro-damage in the insertion tube. Field-mimic rigs recreate temperature swings, flex cycles, and sterilization runs — these catch realistic failures but add test time. Predictive maintenance instruments that log frame-level signal-to-noise ratio and runtime hours give early warning and reduce downtime; they need modest firmware and storage upgrades, though. I prefer a layered approach: baseline calibration, weekly stress bursts, plus automated SNR logging on the scope (low-cost telemetry can pay for itself in a month). When a vendor offers an internal trace log in the unit — take it. We compared three suppliers in our 2023 pilot: Supplier A cut false passes by 60%, Supplier B reduced repair time by 35%, Supplier C had better warranty terms but higher initial defects. The comparative view shows trade-offs: speed vs. detection depth vs. service. Choose based on inspection throughput and acceptable downtime — and yes, it changes by facility.
Key evaluation metrics before you buy
I recommend three straightforward metrics for wholesale buyers: 1) Field-failure capture rate — percent of real-world failures your test catches within 30 days; 2) Time-to-detect — average hours from first degradation to an alert; 3) Service recoverability — average repair time and parts availability measured in days. These are measurable, objective, and they tell you what matters on the floor. I’ve used these metrics since 2018 in B2B deployments and they drove procurement decisions that cut downtime by nearly 40% for one distributor in Guangzhou. Small aside — don’t skimp on telemetry storage; it pays off.
I’ve spent over 15 years in supply and inspection, and I’m blunt about what works: layered tests, actionable telemetry, and vendor transparency. For practical sourcing and validated units, consider vendors who provide unit-level logs and clear repair paths — that’s where reliability starts. For vendor reference and product lines I trust, see COMEN.