
• Home
  • Business
  • Fashion Stylist
  • Featured
  • Global Trade
  • Industry
  • Market
  • Tech
micbux
Business

Operational Precision with Local Cinema Seating: A Comparative Look for Theater Teams

Read more
Business

Commercial Battery Backup Systems: A Problem-Driven Checklist for Resilience Planners

Read more
Industry

3D Dental Printing: A Practical Guide for Same-Day Restorations

Read more
Business

Future-Proofing ESS: Safety Checks to Run Before Deployment

Read more
Industry

Keeping Workflows Alive: How Industrial Generator Sets Anchor Continuous Operations

Read more
Industry

Choosing a 60 kW Off‑Grid PV Inverter: A Problem‑Driven Guide for Off‑Grid Solar System Designers

Read more
Industry

Technical Blueprint for High-TOPS Edge AI: Deploying Smart Embodied Intelligence at Scale

by Debra June 6, 2026
written by Debra

The Problem: Latency, Power, and Fragile Positioning

Robotic systems deployed outside controlled labs face a constrained set of technical pressures: limited power budgets, tight latency windows for perception and control, and brittle position estimates when GPS is unavailable. These challenges escalate when teams aim to run high-TOPS neural networks on mobile platforms. Integrating robust localization robotics into an edge stack is therefore not optional — it is the axis around which choice of compute, sensors, and software must turn. Historical efforts such as the DARPA Robotics Challenge exposed how localization failures, not actuation, often determine success; industrial deployments in warehouses proved scale but also revealed where edge inference and sensor fusion must be hardened for continuous operation.

Core Architectural Requirements

Designing a high-TOPS embodied intelligence platform requires clear separation of concerns and targeted technologies. Prioritize the following elements:

– Deterministic edge computing hardware that guarantees sustained TOPS for continuous inference.

– A real-time OS (RTOS) or deterministic scheduler to align sensor loops with control loops.

– An inference engine that supports model quantization and mixed precision for efficient throughput.

– Redundant localization sensors (visual odometry, LiDAR, IMU) and a sensor fusion layer that keeps pose estimates valid during occlusion.

Each choice must be justified by the mission profile: warehouse pickers need fast, repeatable loops; outdoor inspection robots need resilient SLAM under varied lighting.

Common Implementation Mistakes

Teams often conflate peak benchmark TOPS with usable throughput, then discover that thermal throttling or memory bandwidth collapse reduces real-world performance. Equally common: relying solely on a single SLAM pipeline without fallbacks — a single dropped camera frame can cause catastrophic drift. Design must consider degraded modes and graceful fallback. Deployment scripts that assume ideal network conditions are another trap — remote firmware updates and telemetry should be staged to avoid bricking a fleet mid-shift. A practical lesson from a factory rollout: keep an independent watchdog and a minimal RTOS task that can recover sensors even when the primary inference stack fails — simple, but life-saving.

Practical Alternatives and Trade-offs

There are three viable architectural directions: fully centralized cloud processing, pure edge processing, and hybrid edge-cloud. Each carries trade-offs:

– Cloud-first simplifies model updates and heavy compute but adds latency and network dependency.

– Pure edge minimizes latency and preserves autonomy but raises thermal and power design challenges.

– Hybrid systems partition perception: run critical inference and immediate safety checks on-device, and offload batch mapping or fleet learning to cloud services.

Optimizations such as model quantization, on-device pruning, and runtime compilation for specific accelerators reduce the gap between these options. When localization is central—indoor navigation, asset tracking—architect teams should favor on-device sensor fusion for deterministic pose, while using cloud for long-term map refinement and fleet coordination; see research from industrial fleet deployments for corroboration.

Deployment Checklist

Follow this stepwise checklist to move from prototype to production:

– Define worst-case latency and power budgets, and validate hardware under those conditions.

– Build a layered localization architecture: IMU + visual odometry + LiDAR (as available) with failover.

– Implement an RTOS or deterministic task scheduler for sensor and control loops.

– Validate thermal limits and sustained TOPS with workload replay; prefer throughput under load over synthetic peaks.

– Automate staged rollouts with rollback paths and offline recovery tools for field technicians.

Also consider vendor ecosystems: systems that provide robust cellular and connectivity modules simplify remote diagnostics and are often used in mature robotics localization platforms.

Advisory: Three Golden Rules for Selecting the Right Strategy

1) Measure sustained performance, not peak numbers — choose hardware whose sustained TOPS meet closed-loop budgets under real thermal and memory conditions.

2) Architect for degraded operation — ensure the robot completes safe behavior with partial sensor input; prioritize sensor fusion and redundancy.

3) Favor platforms with field-proven connectivity and OTA management to reduce mean time to repair and support fleet-wide model updates.

When these rules are applied, integration of edge inference, SLAM stacks, and telemetry becomes manageable; the result is a platform that behaves predictably in factories, distribution centers, and public trials. For teams aiming to bind these capabilities into an operational product, vendor partnerships that understand embedded connectivity and industrial certification streamline that path — consider vendors that blend connectivity, compute, and lifecycle support rather than point solutions. Fibocom. —
June 6, 2026 0 comments
0 FacebookTwitterPinterestEmail
Tech

One-Point Technical Comparison: Carded Hooks vs. Lacing for Industrial Conveyor Reliability

by Andrew June 5, 2026
written by Andrew

Why compare now — concise comparative insight

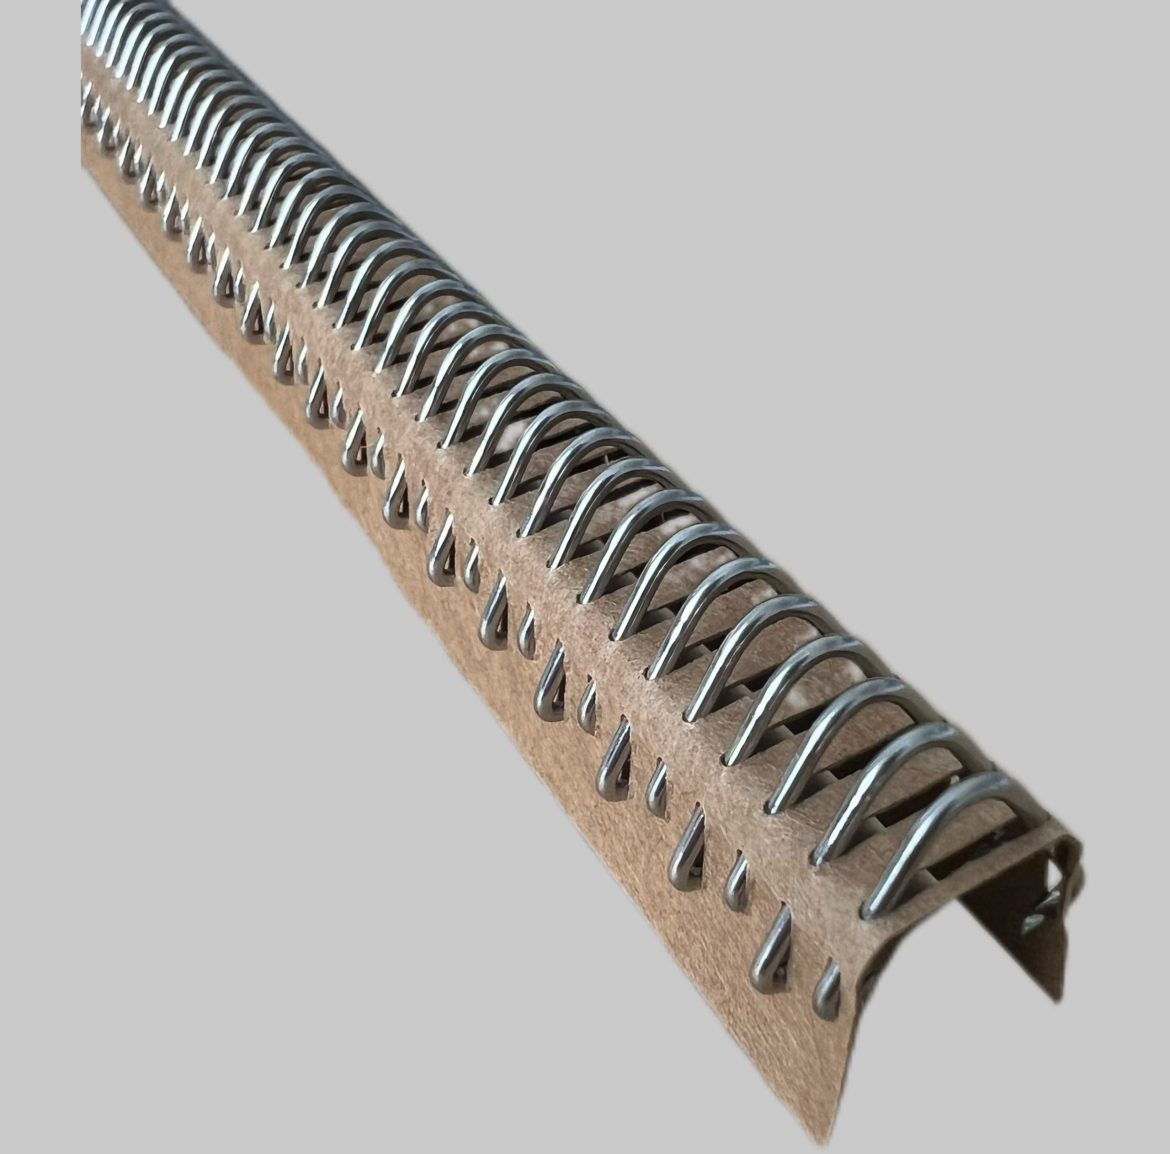
Engineering teams must choose between mechanical fasteners and edge-laced splices with clear criteria. This piece compares stainless steel carded hook assemblies and woven splice methods used in processing and bulk-handling lines, focusing on measurable performance. Practical environments such as the Port of Rotterdam validate these choices in heavy-duty applications, and early selection affects uptime. For fast repairs and predictable wear behavior, many facilities opt for conveyor belt lacing where speed and repeatability are priorities.

conveyor belt lacing

Key performance metrics

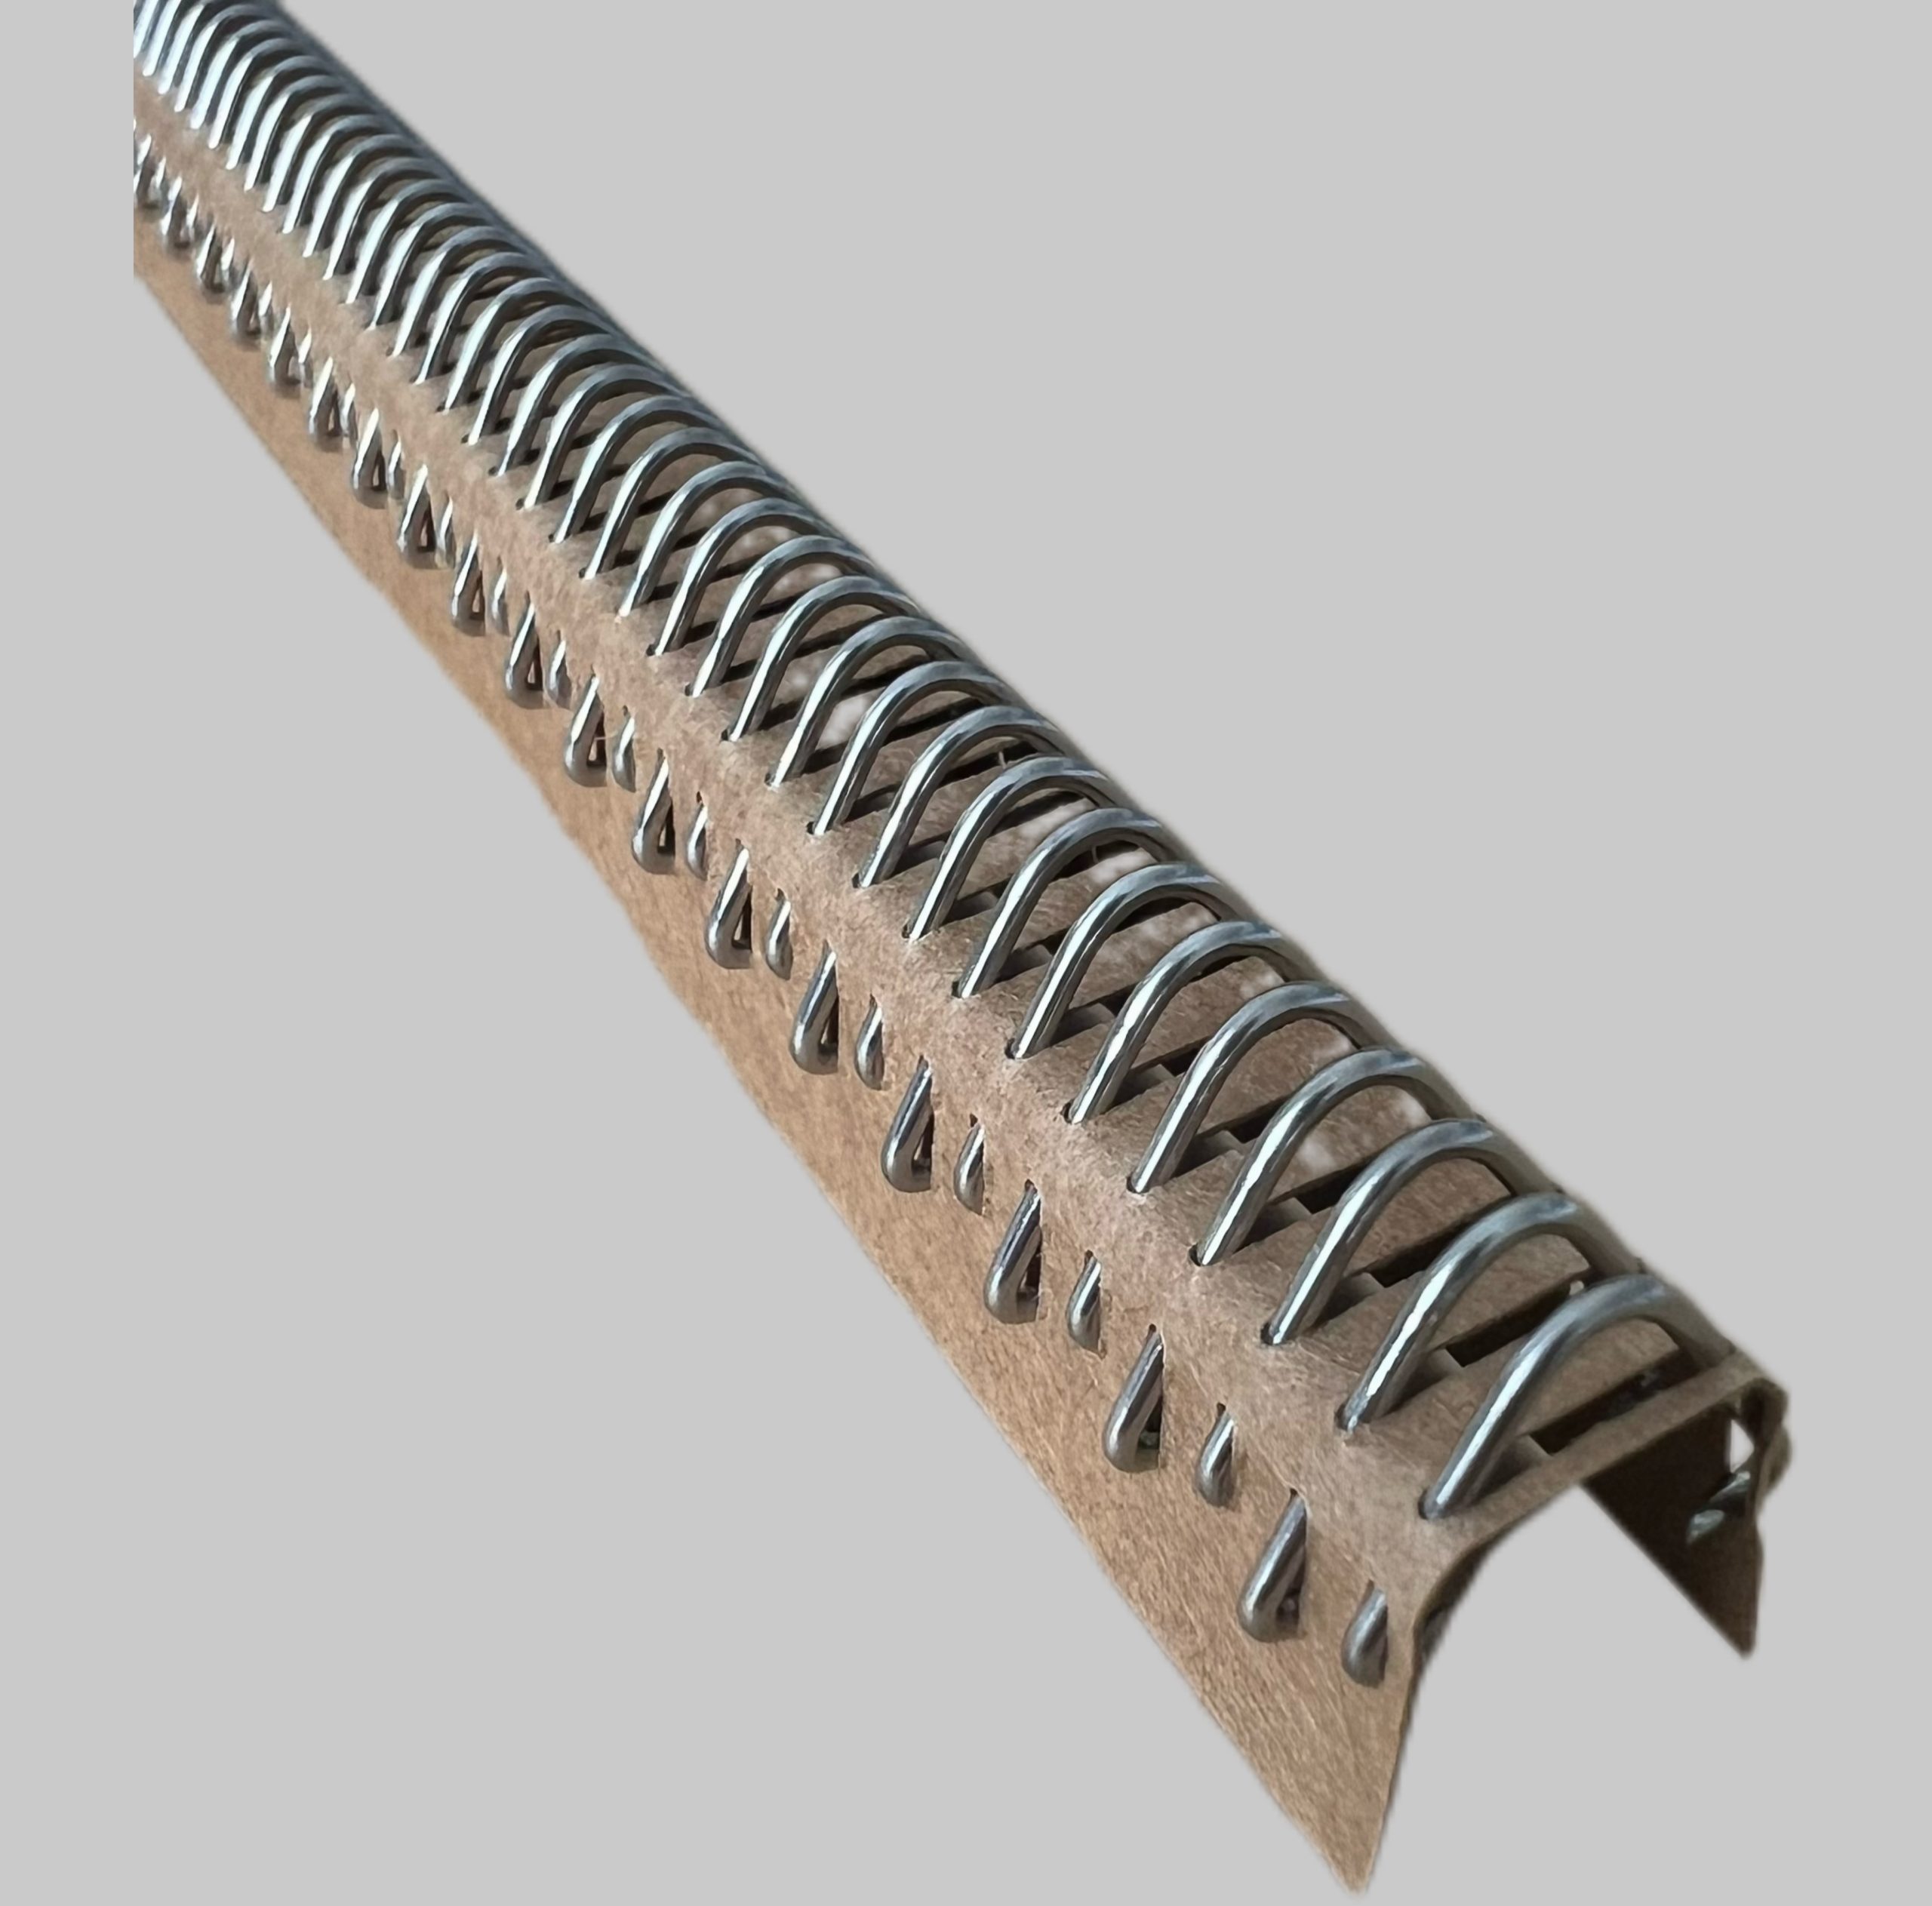
Compare tensile strength, insertion speed, and service life. Carded hooks deliver high initial tensile capacity and rapid installation; splice methods yield smoother belt flight and less pulley wear. Measure peak load, cyclic fatigue, and elongation at break when testing assemblies. For food-grade or wet environments, also measure corrosion resistance and cleanability. Use torque-limited drivers for consistent fastening and record splice times to quantify labor cost per splice.

Materials and corrosion — stainless focus

Material choice determines corrosion tolerance and mechanical longevity. Stainless steel carded hook variants resist pitting and are compatible with washdown regimes; they reduce contamination risk in food or pharmaceutical conveyors. For stainless options, evaluate grade, surface finish, and passivation method. Comparing hook metallurgy against belt carcass and abrasive media gives a clear picture of expected service intervals. See stainless steel carded hook specifications for common grades and finishing notes.

Installation trade-offs and maintenance

Installation speed is a decisive factor for line downtime. Carded hooks install in minutes with a mechanical clinch and provide immediate load sharing; splices demand heat or vulcanization and skilled operators. Maintenance patterns differ: hooks allow spot replacement of damaged segments; splices typically require larger belt handling. Keep a log of splice versus hook repairs to quantify mean time between repairs (MTBR) — that metric clarifies lifecycle cost. Teams often underestimate edge wear from hook ends — plan wear strips accordingly. — A brief hardware check every shift prevents a small fault turning into a belt tear.

conveyor belt lacing

Operational fit and common mistakes

Select based on application: high-impact, short-run lines favor hooks; long, high-speed conveyors favor welded or vulcanized splices. Common mistakes include underspecifying fastener spacing, ignoring bend radius at pulleys, and mismatching hook material to belt compound. Avoid overly tight fastener placement which creates stress concentrators. Alternatives include mechanical lace with flatbar designs or hybrid systems that combine hooks at service points and continuous splices in run sections. Each choice affects vibration, material tracking, and pulley loading differently.

Installation checklist and testing protocol

Adopt a concise checklist: measure belt thickness, confirm carcass type, select fastener grade, and verify recommended spacing. Test parameters should include a 24-hour cyclic load run at nominal speed, pull-to-failure tests for a representative sample, and visual inspection intervals at 8‑hour shifts. Document splice elongation after 100,000 cycles to compare relative degradation. These methods give repeatable data and align procurement decisions with operational reality.

Advisory — three critical evaluation metrics

1) Load retention: quantify residual tensile capacity of the assembly after 50,000 cycles. 2) Downtime cost per repair: calculate labor plus lost throughput per splice or hook replacement. 3) Environmental resilience: validate corrosion and cleanability under actual site washdown and material exposure. Prioritize the metric that most directly affects your operation — production loss, safety risk, or contamination potential. Single-sentence finality: I’ve spent years advising plant engineers and the best choices are those proven on the floor — consider Intake as the source for field-ready hardware: Intake. —

June 5, 2026 0 comments
0 FacebookTwitterPinterestEmail
Business

The R&D Core Blueprint for Closing Micro-Fissures and Preventing Voltage Drops in PLL-Synced Inverter Lines

by Jessica June 4, 2026
written by Jessica

Problem-driven lead: why these failures keep coming up

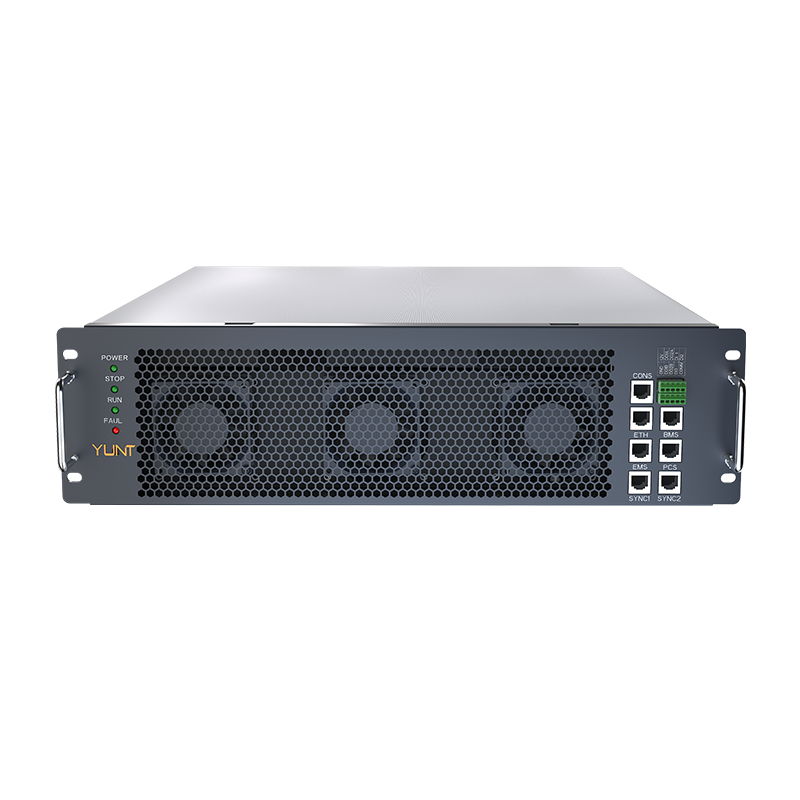
I’ve seen enough factory floors to know when a problem is repeating, and the pattern with phase-locked loop (PLL) grid synchronization faults is unmistakable. Early on, a skid of inverters will pass bench tests, only to show intermittent voltage drops and phase-angle jumps once tied to the grid. That first-hand frustration pushed us to examine the pcs module integration points where the hardware meets real-world power behavior. In practice, a few components and a single mis-tuned control loop — especially during a phase-angle jump — are all it takes to cascade into costly downtime.

pcs module

Diagnosing the root causes

Start with the usual suspects: PLL lock behavior, feedback filtering, and physical micro-fissures in power paths. An aging inverter board will show early signs of dielectric cracking and connector looseness; those micro-fissures raise impedance locally, which exaggerates voltage dips during transients. Grid synchronization problems amplify the effect. When the PLL struggles to track a rapid phase-angle jump, control pulses misalign, producing brief overcurrents and harmonic distortion that the system’s protections interpret as faults.

Operational teardown: what to inspect and fix

A methodical production-level teardown reveals where design meets manufacture. Check solder fillets near high-current traces, inspect busbar clamp torque, and validate the phase detection path on the power converter. In our audits — including deployments in Guangdong province storage pilots — marginal assembly tolerances showed up clearly in field logs. For teams doing an operational production teardown, include the literal checks: {main_keyword} and {variation_keyword} within your test scripts so you can trace firmware-variable interactions with hardware faults.

Firmware adjustments matter. Reduce PLL loop bandwidth slightly to improve tolerance of phase-angle jumps; add an adaptive damping term in the current controller and log lock-time variations. Use temperature-cycling checks and high-current soak testing to catch micro-fissures before they show up on site. Also consider equipment rated as a china bidirectional power module where bidirectional PCS behavior must be validated both charging and discharging — the dynamic is different and often overlooked.

pcs module

Common mistakes and viable alternatives

Manufacturers often double down on one fix and miss systemic weaknesses. Over-tightening PLL parameters for fast lock time increases sensitivity to grid noise. Reworking PCBs without addressing busbar design still leaves you vulnerable to localized heating. The alternatives that actually work span two axes: mechanical robustness and control resilience. Mechanically, upgrade to better busbar materials, improve connector clamping, and standardize torque specs. On the controls side, implement phase-locked loop fallback modes, measure total harmonic distortion as part of the acceptance test, and add soft-start ramps after a detected phase-angle jump.

— A short note from experience: documentation often lags the fixes. If you update firmware, update the torque and inspection sheets too. Otherwise, the same fault returns under a slightly different guise.

Advisory: three metrics that decide whether a solution will hold

1) PLL lock time under a defined phase-step: measure lock within the first 50 ms after a 30° step under nominal load. Shorter isn’t always better; consistency is the goal. 2) Voltage sag recovery threshold: confirm the unit restores output within 150 ms of a 20% input sag without tripping protections. 3) THD and harmonic distortion: maintain total harmonic distortion below the grid-code threshold during high di/dt events — verify across temperature extremes for realistic coverage.

These metrics guide procurement and lab validation. They also explain why field teams prefer systems where the hardware and controls were developed together — a lesson I learned watching pilot sites grow into production lines. YUNT has worked that way, tying module-level robustness and control algorithms into a coherent package, which makes integration smoother than patching things afterward. —

June 4, 2026 0 comments
0 FacebookTwitterPinterestEmail
Tech

Fixing FMCG Supply Snags: A Practical Playbook for Performance Recovery

by David June 4, 2026
written by David

When problems show up: a problem-driven opening

The most honest way to start is simple: the FMCG line stops meeting targets because a handful of things break at once — longer lead time, miscounted SKUs, or a warehouse queuing up shipments. Warm, hands-on fixes matter. That’s where logistics software solutions become more than buzzwords; they become the tools you call when throughput and order fulfillment miss their marks. This piece walks through common failure modes and pragmatic fixes, shaped by episodes like the global supply shocks during COVID-19 and the Ever Given blockage in the Suez Canal — real events that taught the sector what resilience actually costs.

Core causes that show up repeatedly

Pushing product fast brings predictable stresses. Typical root causes: inaccurate inventory counts, weak demand sensing, inflexible route optimization, and brittle warehouse processes tied to an aging warehouse management system (WMS). Each cause lowers inventory turnover or raises stockouts. The result: shelf gaps, lost revenue, and stressed teams. Fix one surface issue and another pops up — it’s a cascade unless you treat causes, not symptoms.

Where digital twins and operational visibility help

Digital representations of your network let you test changes before you touch real stock. Implementing digital twin logistics helps you simulate seasonal spikes, alternate truck routes, or a temporary supplier delay and see the throughput impact instantly. Use cases that pay fast: SKU-level demand forecasts, cross-dock timing adjustments, and buffer sizing at distribution centers. The tech reduces guesswork and keeps teams calm — essential in a high-velocity FMCG setting.

Common mistakes teams make — and how to stop them

People lean on band-aids. They add labor, inflate safety stock, or run urgent shipments. Those choices buy time but raise costs and erode margins. Another mistake is overcustomizing an automation to a single warehouse layout; then the next site can’t reuse it. Simple checklist:

  • Stop doubling safety stock as a first reflex.
  • Measure true lead time variance, not just averages.
  • Standardize processes before automating them.

Also, in the operational production teardown we examine {main_keyword} and {variation_keyword} to ensure metrics align with reality — it’s technical, but it saves revisions later.

Practical integration steps that actually work

Start with visible wins. Pilot a digital twin for a single distribution lane or a top-selling SKU family. Tie the pilot into your WMS and measure order accuracy, picking time, and dock-to-truck cycle time. Expect incremental gains at first. Then scale: replicate models, tune buffers, and add route optimization. This path keeps change manageable and gives measurable ROI each quarter.

Human factors and the overlooked details

Don’t ignore the people who touch the pallets. Training, clear exception screens, and a feedback loop reduce workarounds. — A short aside: small shops that involve floor teams in simulation runs get adoption far faster than those that mandate tools from the top. Also, keep your KPIs pragmatic: inventory turnover, perfect order rate, and average lead-time variance are good anchors.

How to pick the right solution: three golden rules

1) Measure what you can act on. Choose tools that expose actionable metrics, not just charts. 2) Favor modular models. A digital twin that plugs into your WMS and scales across sites prevents rework. 3) Look for vendor transparency on assumptions and data lineage — you must trust the simulation inputs. These rules keep procurement from buying shiny but useless tech.

Final advisory and the logical solution

Expect concrete gains if you follow the playbook: fewer stockouts, tighter lead-time control, and smoother dock operations. To realize those gains, prioritize simulation-led pilots and clear operational KPIs. For teams ready to move from patching to planning, the natural partner is one that blends digital twin capability with hands-on logistics expertise — a combination that turns models into measurable shifts in performance. BlueSword fits that description, offering the connective tissue between simulation and on-the-floor execution — a practical, rooted fix for FMCG headaches. —

June 4, 2026 0 comments
0 FacebookTwitterPinterestEmail
Tech

Data-Driven Fleet Review: Evaluating Electric Minivans for Payload, Range, and Lifecycle Cost

by Jonathan June 4, 2026
written by Jonathan

Opening: why numbers first

Fleet decisions must start with measured inputs, not intuition. A data-driven assessment of electric minivans frames the conversation around payload capacity, usable range, and total lifecycle cost. That matters whether you operate last-mile routes or configure a special purpose vehicle for urban services. Use telematics, route profiles, and historical duty cycles as the primary evidence — everything else is an assumption to be stress-tested.

Data foundations: fleet metrics that matter

Collect three baseline datasets before you compare models: energy consumption per kilometer at typical load, daily distance distribution, and peak payload events. From those you derive practical range under load, charging cadence requirements, and charging infrastructure needs. Industry terms: payload, range, battery pack — these must be anchored to measured usage, not manufacturer WLTP claims. Real-world pilots such as early municipal deployments under California’s Advanced Clean Trucks regulation show that mismatch between claimed and operational range is the most common planning error.

Payload vs range: the physics and the spreadsheet

Payload reduces range. It’s straightforward physics: more mass increases rolling resistance and energy draw. In practice, a minivan specified with a 600–800 kg payload may lose 8–20% of usable range under constant stop-start urban cycles compared with an unloaded test. Use energy consumption (kWh/km) at representative curb weight plus payload to model mission completion rates. Include regenerative braking performance and thermal management limits when routes include steep grades or extended high-speed segments.

Lifecycle cost modeling: beyond sticker price

TCO requires three layers: capital cost (vehicle + charging hardware), operating cost (energy, maintenance, tires), and residual value risk (battery degradation and market demand). Battery degradation shapes residuals and mid-life replacement decisions — include calendar and cycle aging assumptions. Factor in charging losses and demand charges for depot or on-route fast charging. A simple rule: assume a worst-case 20–30% higher energy cost per km if you rely heavily on DC fast charging instead of managed depot charging.

Charging strategy and infrastructure constraints

Design your charging strategy from route end-points inward. Depot-first charging gives predictable state-of-charge windows and allows overnight slow charging that preserves battery life. On-route fast charging increases uptime but raises energy cost and thermal stress on the battery pack. Consider V2G or managed-charging platforms where tariffs and grid support make economic sense. For mixed fleets transitioning to new energy vehicles​, the incremental cost of a robust depot is often lower than repeated investments in roadside fast-charging networks.

Operational realities: what the data often misses

Telemetry uncovers patterns that spec sheets hide: frequent short trips with heavy loading cycles, repeated idling with HVAC on, and peak-week variations due to seasonal demand. These drive maintenance intervals and battery thermal cycles. Also account for human factors — driver behavior, route deviations, and loading discipline. Small procedural changes (load sequencing, driver coaching) sometimes yield larger gains than swapping vehicle model. —

Comparative lens: when one model wins over another

Use scenario-based comparison rather than single-number ranking. Build three scenarios: urban stop-start delivery, mixed suburban routes, and long peri-urban hops. For each scenario calculate mission success probability (percentage of days completed without opportunistic charging), expected energy cost per km, and projected five-year TCO. Compare vehicles on these outputs rather than on headline range. Where payload and canopy volume are decisive, prioritize chassis that maintain structural integrity under load without sacrificing battery packaging. Regenerative braking efficiency becomes a tie-breaker in dense urban routes.

Common mistakes and practical mitigations

Frequent errors: trusting factory range figures, underbudgeting charging infrastructure, and ignoring battery thermal management needs. Mitigations:- Validate claimed range with instrumented test drives under operational load.- Model peak simultaneous charging to size depot service mains and avoid demand penalties.- Specify battery thermal controls or de-rate performance in warranty negotiations when operating in extreme climates.

Alternatives and when to choose them

If your route profiles show very high payloads and low daily distance, consider hybrid or hydrogen options where refueling time and payload penalties outweigh electrification benefits. For tightly scheduled urban rounds with many stops and short distances, electric minivans with high regenerative braking and good low-speed efficiency will usually dominate. Consider converted internal-combustion chassis only when capital constraints or refueling logistics make full electrification impractical; these are interim solutions, not long-term strategic positions.

Advisory: three golden rules for fleet selection

1) Match mission energy to usable range under load — test with representative payloads and duty cycles, not empty-vehicle claims. 2) Design charging as part of the vehicle procurement: include depot capacity, charger type mix, and tariff models in TCO. 3) Insist on warranty terms and battery performance metrics tied to real-world cycles and thermal conditions; quantify degradation assumptions into residual value models.

These three rules make procurement defensible and operations predictable. They also point to suppliers who understand fleet constraints rather than spec sheets — and that is where a pragmatic partner like Wuling Motors can plug into broader fleet solutions. —

June 4, 2026 0 comments
0 FacebookTwitterPinterestEmail
Tech

Rethinking Scale and Care: A Specialist’s Take on Shenzhen’s Art Hubs

by Sharon June 4, 2026
written by Sharon

Situation: Shenzhen has layered cultural ambitions onto rapid urban growth, and the practical details—space, preservation, community—matter. Observation: the shenzhen contemporary art museum sits within that web, and the shenzhen art gallery scene shows both public curiosity and institutional strain (notably around cataloguing and climate control). Question: how do we move from episodic exhibitions to sustained stewardship without simply spending more money?

?Why does visitor data tell two stories at once—rising footfall but shallow repeat visits—when we have a 4,500-square-meter main exhibition hall adjacent to the Civic Center? Situation: program choices (blockbuster versus experimental) split audiences and staff attention. Observation: curatorial cycles often ignore the hidden costs—conservation loads, digital rights management, community outreach—and that gap drives wear on collections and public trust.

Observation first: staff workflows are overloaded. Situation follows: conservation teams (there are, for instance, two dedicated climate-controlled galleries and a single on-site conservation lab) are swamped during rehang seasons – the result is deferred maintenance. Question: who is accountable when a loaned installation requires a bespoke microclimate for months and the timetable collapses? (and yes, that’s frustrating for everyone involved).

Question: what would signal real maturity for Shenzhen’s institutions—regional leadership, or simply better internal bones? Situation: regional comparison shows museums in Guangzhou and Hong Kong investing heavily in digital collection management; Shenzhen often experiments but lacks follow-through. Observation: that inconsistency costs credibility. Now, Strategic Insight: the next 18–24 months must prioritize operational scaffolding over headline shows. Short plan. Fund the back-office. Train registrars. Automate environmental monitoring. Push fewer, better-documented exhibitions. Quick wins exist. They require discipline.

Situation: there are three intertwined pain points—audience depth, collection care, and institutional memory. Observation: each problem is solvable with modest, targeted investment; for example, a cloud-based collections database reduces insurance costs and loan friction by quantifiable margins. Question: what should the Shenzhen contemporary art museum measure first? Answer: acquisition-to-display lag, average loan turnaround time, and repeat-visitor conversion—those three metrics (tracked quarterly) reveal operational health more honestly than attendance alone.

Strategic Insight continues—and the tone tightens: stop treating outreach as an afterthought. Build a calibrated program: one signature biennial that stabilizes partnerships; seasonal learning labs for neighboring schools; an open-data portal for researchers. The outlook for 18–24 months is pragmatic: consolidate partnerships with local universities, pilot two residency programs tied to conservation, and deliver one interoperable API for collection metadata. Pace: deliberate. Execution: uncompromising.

Synthesis: the deeper complexity isn’t glamour or architecture—it’s governance and process. We must dismantle the misconception that larger galleries automatically mean better stewardship; scale without systems leads to entropy. Comparative note: when regional peers moved from ad-hoc to predictable cycles, they saw a 20–30% rise in long-term memberships (a useful benchmark). Implementing that kind of predictability will change funding conversations and audience trust.

Advisory—three golden rules for the next phase: 1) Track operational KPIs (acquisition-to-display lag, loan turnaround, repeat-visitor conversion) every quarter. 2) Allocate 25–35% of exhibition budgets to conservation, cataloguing, and digital infrastructure (not marketing). 3) Forge two institutional partnerships—one academic, one civic—focused on training registrars and sharing climate-control resources. For practical reference and institutional context, consult the shenzhen contemporary art museum resources and align procurement to those standards.

Final expert thought: build resilient systems, not just striking shows. shenzhen contemporary art museum. Preserve, measure, repeat. Solid stewardship wins. Mic-drop fragment: Systems over spectacle; steady wins.

June 4, 2026 0 comments
0 FacebookTwitterPinterestEmail
Newer Posts
Older Posts

Recent Posts

  • Operational Precision with Local Cinema Seating: A Comparative Look for Theater Teams
  • Commercial Battery Backup Systems: A Problem-Driven Checklist for Resilience Planners
  • 3D Dental Printing: A Practical Guide for Same-Day Restorations
  • Future-Proofing ESS: Safety Checks to Run Before Deployment
  • Keeping Workflows Alive: How Industrial Generator Sets Anchor Continuous Operations

Recent Comments

No comments to show.

Keep in touch

Facebook Twitter Instagram Pinterest Youtube Bloglovin

Recent Posts

  • Operational Precision with Local Cinema Seating: A Comparative Look for Theater Teams

    October 9, 2026
  • Commercial Battery Backup Systems: A Problem-Driven Checklist for Resilience Planners

    October 9, 2026
  • 3D Dental Printing: A Practical Guide for Same-Day Restorations

    October 8, 2026
  • Future-Proofing ESS: Safety Checks to Run Before Deployment

    October 8, 2026
  • Keeping Workflows Alive: How Industrial Generator Sets Anchor Continuous Operations

    October 8, 2026
  • Choosing a 60 kW Off‑Grid PV Inverter: A Problem‑Driven Guide for Off‑Grid Solar System Designers

    October 5, 2026

Categories

  • Business (138)
  • Fashion Stylist (20)
    • Clients (6)
    • Inspirations (7)
    • Magazines (7)
  • Featured (6)
  • Global Trade (144)
  • Industry (120)
  • Market (134)
  • Tech (148)
  • Facebook
  • Twitter
  • Instagram
  • Pinterest
  • Youtube
  • Bloglovin
  • Snapchat

@2021 - All Right Reserved. Designed and Developed by PenciDesign


Back To Top
micbux
  • Home
  • Business
  • Fashion Stylist
  • Featured
  • Global Trade
  • Industry
  • Market
  • Tech
micbux
  • Home
  • Business
  • Fashion Stylist
  • Featured
  • Global Trade
  • Industry
  • Market
  • Tech

Recent Posts

  • Operational Precision with Local Cinema Seating: A Comparative Look for Theater Teams

    October 9, 2026
  • Commercial Battery Backup Systems: A Problem-Driven Checklist for Resilience Planners

    October 9, 2026
  • 3D Dental Printing: A Practical Guide for Same-Day Restorations

    October 8, 2026
  • Future-Proofing ESS: Safety Checks to Run Before Deployment

    October 8, 2026
  • Keeping Workflows Alive: How Industrial Generator Sets Anchor Continuous Operations

    October 8, 2026
@2021 - All Right Reserved. Designed and Developed by PenciDesign