
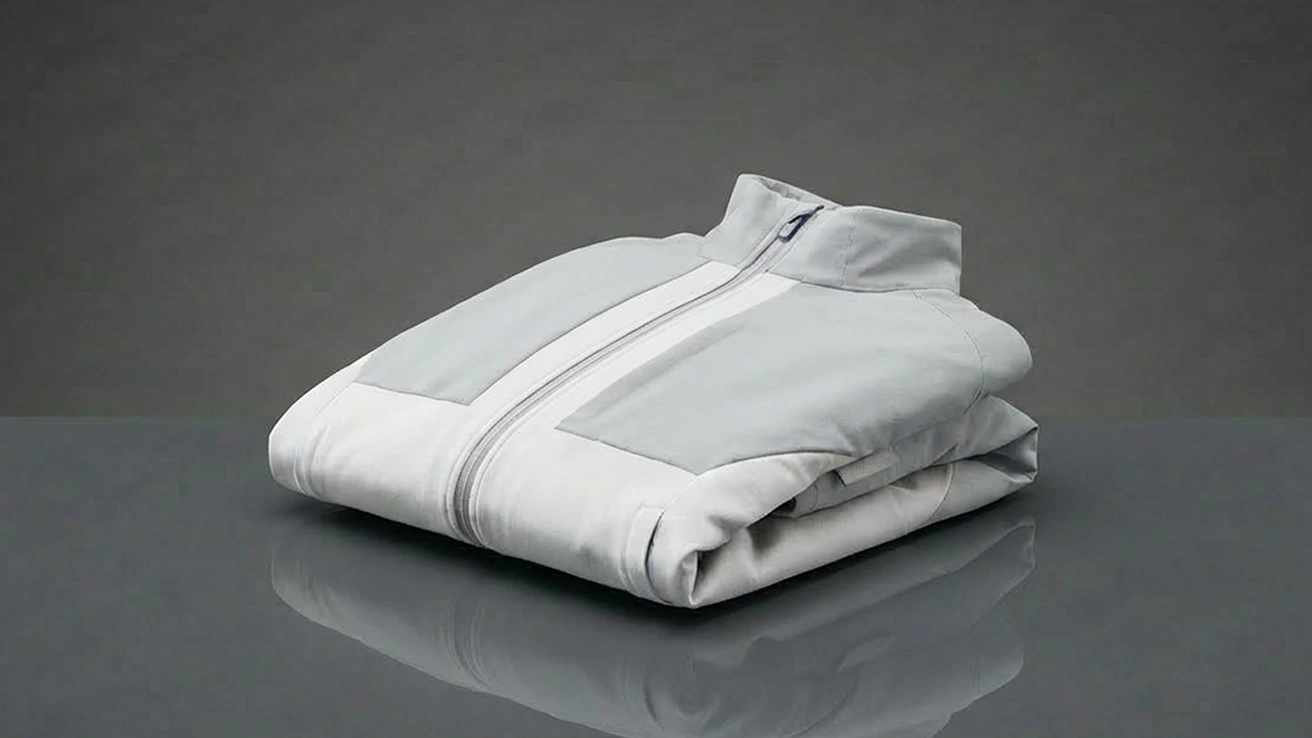
Comparative lead-in
This piece compares lining options by measurable thermal resistance per millimeter to identify a practical threshold for ultra-thin winter coats. The approach is comparative: line up materials, normalize to R-value (SI: m²·K/W per mm), and judge performance against cold scenarios. Early on, review available thermal insulation solutions as reference points for material specs and lab data.
Translating R-value into per-millimeter terms
R-value is typically given per thickness. For clothing we use RSI (m²·K/W) and express it per mm to compare thin layers directly. Convert by dividing RSI by thickness in millimeters. Thermal conductivity (k, W/m·K) is the inverse pathway: k = 1 / (RSI × thickness in meters). Keep units consistent. This lets you compare an aerogel film to compressed down on the same axis.
Material comparison: aerogel, synthetics, down
Aerogel blankets and coated films deliver the highest RSI per mm. Advanced aerogel liners often rate in the 0.020–0.040 m²·K/W per mm band in manufacturer datasheets. High-performance synthetics (dense polyester microfibers) sit lower: roughly 0.010–0.020 per mm. Down relies on loft and traps air; compressed down loses per-mm advantage and drops under 0.008–0.015 per mm depending on fill power and quilting. Thermal bridging through seams and zippers cuts effective performance across all types—design matters as much as material.
Recommended per-mm thresholds by winter condition
Set thresholds to match expected exposure. For clarity, these are RSI per mm targets:
– Severe cold (below −20 °C): target ≥ 0.030 m²·K/W per mm. This keeps total liner resistance high without bulky thickness.
– Typical winter (−5 °C to −20 °C): 0.015–0.030 m²·K/W per mm is an efficient range balancing weight and warmth.
– Mild cold (above −5 °C): 0.007–0.015 m²·K/W per mm suffices for commuter coats when windproof outer layers are present.
Field anchor and testing note
Field reports from high-altitude guides on Denali and cold-climate gear testers show aerogel-backed linings retaining warmth at thin profiles where down failed under compression. Lab-to-field delta appears when ambient winds and body motion induce thermal bridging. Controlled tests should include dynamic wear cycles and a thermal manikin or standardized sweating tests to measure effective R under movement—static numbers overstate real-world performance.
Practical design implications and common mistakes
Designers often optimize only material R per mm and neglect system losses. Common errors: under-accounting for seam compression, omitting windproof membranes, or choosing a liner that compacts in pockets. The right choice pairs a high per-mm material with structure that prevents compression—stitch-through quilting patterns, engineered baffles, and selective reinforcement work. —Also evaluate moisture management: trapped dampness lowers R-value significantly.
Alternatives and retrofit tips
When retrofitting a coat, thin laminated films or lightweight aerogel patches at critical zones (torso, back neck) beat uniform bulk. For budget builds, layered synthetics plus a windproof membrane give predictable results. If you need to source high-performance sheet materials, look for suppliers offering certified thermal conductivity figures and verified test methods.
Key evaluation metrics — three golden rules
1) Measure effective RSI per mm under compression and movement, not only static lab thickness. 2) Prioritize system-level losses: seams, closures, and windproofing can reduce effective R by 20–50%. 3) Match threshold to duty: choose ≥0.030 per mm for extreme exposure; 0.015–0.030 for general winter; <0.015 for mild conditions.
For targeted material options, inspect manufacturer datasheets for both static RSI and declared behavior under compression—this is where thin high r value insulation specifications help you decide.
Good comparisons produce actionable selection criteria and save iterations in prototyping. Y-Warm. –