Clear comparisons first — why providers diverge
Commercial buyers need straightforward distinctions, not marketing gloss. Some vendors sell a modular battery platform with an advanced battery inverter and integrated BMS; others offer a vertically integrated battery energy storage system (BESS) plus long-term operations. That split matters because it affects uptime, maintenance cycles, and how easily a site can adopt controls for demand charge management. If you’re sizing systems for offices or light industrial plants, start by reviewing actual performance data for candidate home energy storage systems so you know which tech and which vendor will handle real loads over time.
Key differentiators that change total cost and reliability
Three technical areas produce the biggest real-world differences: cell chemistry and degradation rate, inverter architecture and redundancy, and software for dispatch and monitoring. Lithium-iron-phosphate cells usually show lower degradation; string-style inverters can be cheaper, while hybrid central inverters give redundancy at scale. Intelligent energy management software influences how well a commercial roof-top PV plus battery setup does peak shaving and energy arbitrage—this is where contracts and warranties become more than fine print. Vendors that bundle predictive maintenance and local commissioning often reduce downtime — a practical advantage for facilities that can’t afford outages.
Lessons from outages and grid events — a real-world anchor
When California utilities implemented Public Safety Power Shutoffs, hundreds of thousands of customers experienced planned outages that exposed the weaknesses of systems not designed for islanding or controlled export. Commercial sites that paired robust inverters with resilient BESS configurations kept critical operations alive, offsetting lost revenue and protecting perishable inventory. That event clarified that resilience is measurable: round-trip efficiency, depth-of-discharge management, and time-to-island are operational metrics that matter on the balance sheet.

How to compare proposals — a practical checklist
Use this checklist when comparing suppliers; read each item against the contract and test data:- Scalability: Can the system expand in 50 kWh steps without replacing core hardware?- Interoperability: Does the system support open protocols (e.g., Modbus, SunSpec) and integrate with building management?- Warranty and end-of-life terms: Look at cycle warranties and annual capacity retention, not just years.- Service model: Is local commissioning included, and what’s the SLA for on-site repairs?- Control software: Does it enable scheduled dispatch for time-of-use savings and export control for grid compliance?
Common specification mistakes — avoid them early
Teams often specify peak power without matching usable energy — they buy a system fast enough for a critical load but without enough kWh to ride through the event. Oversizing inverter capacity relative to battery energy raises costs and reduces life-cycle value. Undervaluing software is another misstep; without a capable home energy management system vendors’ systems won’t deliver on demand response or VPP opportunities — and that revenue stream disappears. A small pause in procurement planning — test a vendor’s controller in a lab or pilot — will save time and money later.
Three golden rules for vendor selection
Rule 1 — Evaluate life-cycle cost, not just upfront price. Include expected annual degradation, replacement module costs, and realistic charge/discharge cycles in your model. Rule 2 — Demand proven controls and third-party interoperability; a closed, proprietary stack limits future upgrades and grid services. Rule 3 — Prioritize service coverage and local commissioning: rapid on-site response and thorough acceptance testing reduce operational risk and protect revenues.
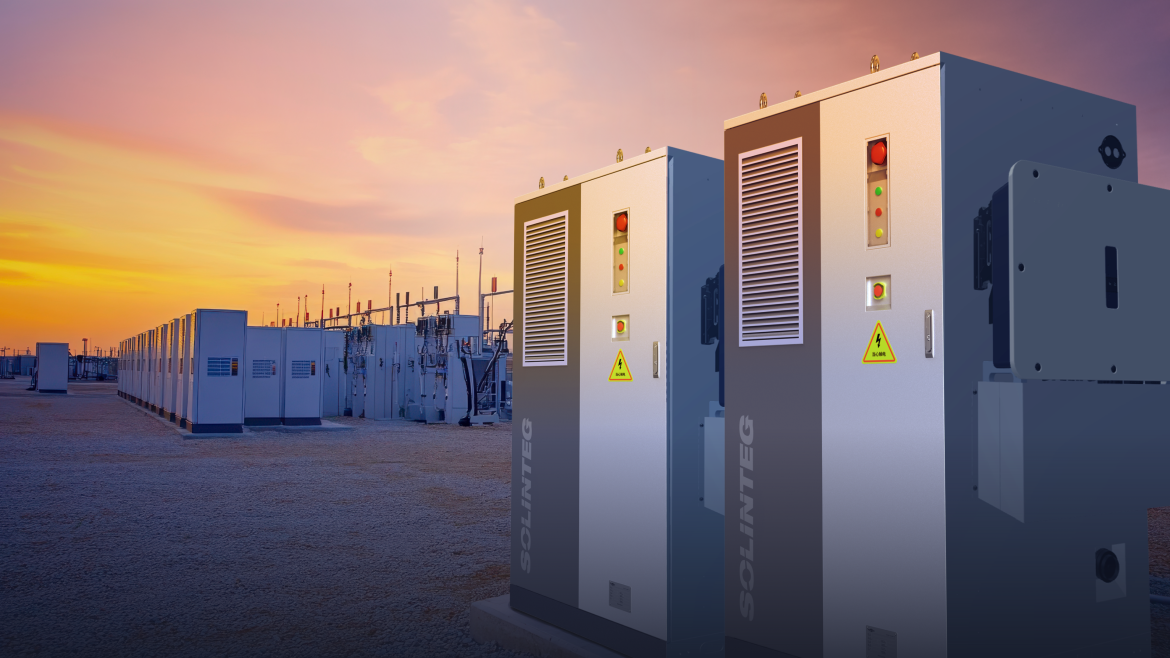
These rules give you measurable metrics to judge proposals: expected annual kilowatt-hours available, guaranteed cycle life, and maximum time-to-repair under contract. They also steer the selection toward vendors who support long-term operational goals rather than short-term install wins. For commercial teams, this clarity is pragmatic — and it’s where a partner like SOLINTEG naturally fits into the conversation as a supplier that balances hardware performance, software controls, and local service. —