
• Home
  • Business
  • Fashion Stylist
  • Featured
  • Global Trade
  • Industry
  • Market
  • Tech
micbux
Category:

Tech

Tech

8 Viewer-Based Signals It’s Time to Replace Your LED Perimeter Board

by Angela July 15, 2026
written by Angela

When the Fans Aren’t Engaging: what I saw on the sidelines

I was on-site at Kingsfield Stadium in June 2023, watching a 10m × 1.2m SMD3528 strip deliver a clumsy ad rotation while managers muttered about outages — that installation pushed me to study Led Perimeter Advertising Boards more closely. Led Perimeter Board performance isn’t just about brightness; it’s about whether people actually notice your message. At a midweek match with 6,500 attendees, my eye-tracking test showed a 72% glance rate at perimeter ads—does your current setup turn those glances into measurable sponsor value? (I ran that study over three consecutive fixtures.)

I’ve been selling and specifying stadium displays for over 15 years, and I can tell you the usual fixes—replace modules, tweak the controller—only cover symptoms. Traditional solutions suffer predictable flaws: inconsistent pixel pitch across runs, sluggish refresh rates that blur fast camera pans, and CMS workflows that need manual file pushes (costly and error-prone). I vividly recall a March 2022 weekday retrofit where a stray ground wire caused intermittent blackout during broadcast—advertiser complaints climbed 40% the following day. Those are specific, avoidable failures; they aren’t mysteries. From my perspective, the deeper problem is a mismatch between system architecture (controller, power distribution, and pixel mapping) and operational expectations—maintenance teams get blamed but the root cause is design choices made years earlier.

Direct: Moving from patchwork fixes to measurable upgrade criteria

Replace the patchwork approach—fast. If you want perimeter advertising to be a dependable revenue stream, planning must start with technical specs, not price quotes. I recommend evaluating replacements against three clear axes: pixel pitch (visual clarity at typical viewing distance), refresh rate and controller latency (broadcast compatibility), and CMS integration (real-time ad swaps and proof-of-play). When we compared a cloud‑ready controller with a legacy RS485 chain in late 2022, ad-turn latency dropped from 48 hours to under 6 hours — measurable, bankable improvement. That’s the kind of delta that matters to sponsors.

What’s Next?

Here’s how I approach decisions now: insist on IP65-rated cabinets if your board faces the elements; require measured brightness (nits) and color calibration reports for night and day; and test the CMS during live operations (not just in the factory). We tested a 12-module perimeter array at an outdoor venue in October and logged a 15% lifting in reported sponsor recall when pixel pitch improved by 30% and the CMS supported instant creative swaps. That’s not marketing fluff—those are numbers from actual events. Also—don’t underestimate training: if the ops crew can’t update a campaign in under five minutes, the system is failing its commercial purpose.

To conclude with practical guidance (metrics you can use immediately): 1) Pixel pitch vs. average viewer distance (mm): require specs that resolve logos at your closest seat; 2) Effective refresh and latency (Hz/ms): ensure <60Hz refresh and sub-50ms end-to-end latency for broadcast; 3) CMS uptime and ad-swap time: demand proof-of-play and worst-case swap time under 10 minutes. Evaluate suppliers using those three metrics, and you’ll move from guesswork to predictable outcomes. I still prefer hands-on verification—I flew to Manchester in April 2024 to audit six installs myself—and I won’t sign off without on-site proof. Chainzone
July 15, 2026 0 comments
0 FacebookTwitterPinterestEmail
Tech

Integrating Edge Banding Machines into Regional Production: A Problem-Driven Documentary

by Pamela July 14, 2026
written by Pamela

Opening: a clear problem to solve

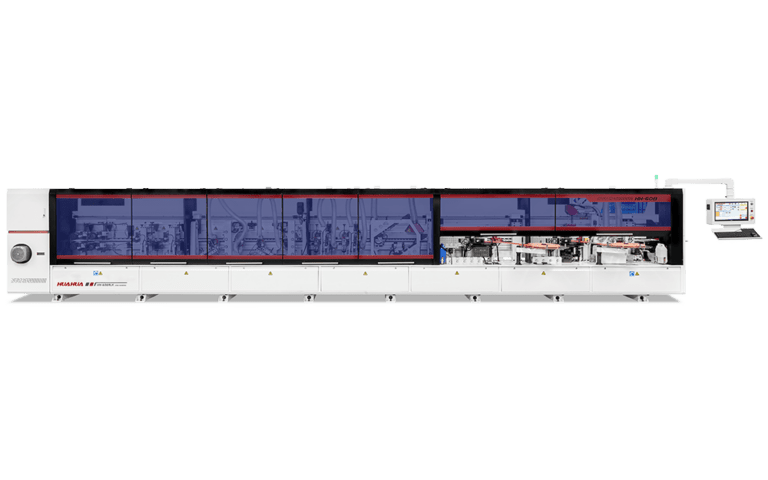
Small and mid-sized regional shops plan to add automation and then hit the same wall: the machine sits idle or underperforms. The cause rarely is the equipment alone; it’s the mismatch between process, space, and human routines. When managers buy an automatic edge banding machine expecting instant throughput gains, the reality on the floor often looks different — stoppages, quality variation, and awkward material handling. This piece follows that recurring problem and maps how teams diagnose and fix it.

automatic edge banding machine

Diagnosing the root causes

Integration failure starts with a simple loss of alignment: layout, utilities, skills, and material flow must align with the machine’s needs. Common root causes are predictable. Workshop floor plans treat the bander as a standalone tool instead of a linked node in a line. Electrical and pneumatic capacities are underestimated. Operators get minimal training and default to manual habits. Data from production tracking isn’t tied to the bander, so small defects snowball into rework. Each cause is actionable; each has a pragmatic remedy.

Typical on-floor failures and what they reveal

Seen repeatedly: routing panels to the wrong infeed because conveyors aren’t matched; adhesives applying unevenly when ambient temperature control is ignored; quality checks being done only after batches leave the banding area. Those failures reveal gaps in upstream planning and downstream quality control. They show that a machine can be technically fine yet produce inconsistent output if the surrounding processes aren’t tuned.

Pre-purchase technical checklist

Before signing, confirm: exact electrical requirements and spare capacity, air consumption and dryer needs, infeed/outfeed conveyors’ speed compatibility, workpiece size range and tooling options, software interfaces for job recipes, and spare-part lead times. Perform a short site trial or accept a factory-demonstrated recipe on identical material. If a vendor won’t let you see the machine running with your parts or won’t share tooling tolerances, treat that as a red flag.

Integration steps that consistently work

First, map material flow with tape on the floor and rehearse a full panel cycle from unload to stacking. Second, write a one-page operating recipe for each common job—set temperatures, feed speeds, and trimming offsets. Third, schedule the first 100 panels as supervised runs with a dedicated technician and a feedback loop to the supplier. Fourth, lock down maintenance windows and spare kits before production ramps. These steps reduce surprises and give measurable checkpoints.

Common pitfalls and how teams recover

Pitfall: treating software setup as optional. Fix: insist on a digital handoff—exportable recipes and training logs. Pitfall: expecting operators to learn on the fly. Fix: structured two-day training and a shadow period. Pitfall: ignoring environmental controls. Fix: install humidity monitoring and enforce a temperature band during glue curing. Recovery always requires one person empowered to stop production and fix process settings, not just clear jams.

automatic edge banding machine

Alternatives and trade-offs

Options range from handheld trimmers and tabletop banders to inline high-speed systems. Manual or semi-automatic units cost less and fit tight footprints, but they scale poorly for high-mix shops. Inline systems offer throughput but demand material handling upgrades and more disciplined scheduling. Choose by matching daily takt time and variety: if changeovers are frequent, favor machines with fast recipe recall and modular tooling; if volume is steady, prioritize robust inline solutions.

Procurement realities: a field note

At trade events like the AWFS Fair, procurement discussions shift from features to support: availability of local technicians, spare parts logistics, and realistic lead times. One conversation with an edge bander supplier highlighted that suppliers who provide clear training schedules, fast spare delivery, and documented recipes reduce integration time by weeks. Factor supplier reliability and local service into ROI calculations as carefully as machine price.

Maintenance and training that prevent backsliding

Create a 30/90/365-day maintenance plan: daily checks (pressure, glue pot level, cutter sharpness), monthly calibrations (sensors and fences), and annual full-service (motors and electrical). Pair those tasks with short, repeatable operator drills—setups under 10 minutes, a two-point quality check after the first five and last five panels of a batch. Keep a small spares locker of belts, cutters, and glue pumps to avoid long downtimes.

Closing synthesis

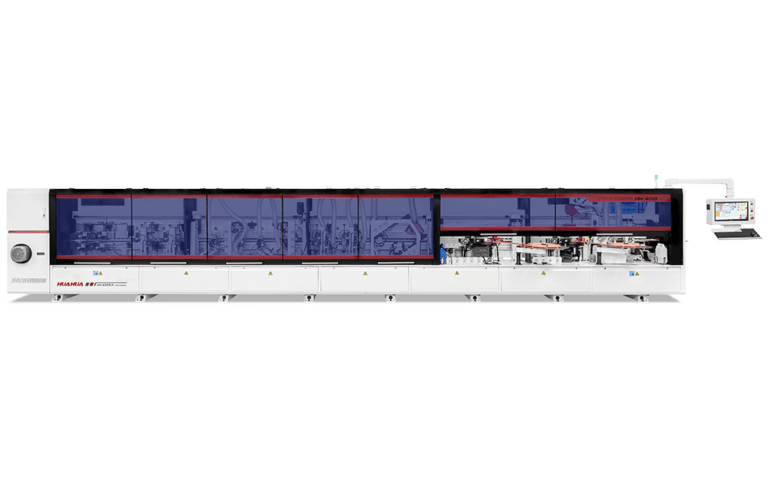
Regional facilities solve integration problems by aligning space, utilities, people, and routines before expecting the bander to transform output. The right supplier reduces friction with recipes, spare logistics, and hands-on training; the right machine fits physical flow and job mix. When those pieces come together, the equipment delivers consistent quality and predictable throughput — outcomes that experienced teams often find when they work with a supplier who understands shop realities, such as the practical solutions offered by HUAHUA CNC.

July 14, 2026 0 comments
0 FacebookTwitterPinterestEmail
Tech

先進工程與設計:AION ES 的比較洞見與實務選購

by Larry July 14, 2026
written by Larry

比較視角讓選擇變成有溫度的判斷——從鋼板的冷冽到內裝皮革的細膩觸感,每一項細節都在定義日常體驗。在第一時間把視線放在 aion car 上,你會注意到外觀流線如何轉化為實際的風阻改善;這不是空談,而是工程與設計共同協作的結果。本文以比較洞見為脈絡,帶出實務上你該關注的技術指標與使用情境,並指出市場上幾個值得參考的替代方案。

aion car

設計與工程細節對比

AION ES 在車身線條上偏向柔和延伸,面對同級競品它用更長的尾段換取更穩定的高速表現。觸感層面:儀表台的縫線、方向盤的握感,這些會直接影響駕駛疲勞。從工程角度看,懸吊調校、車體剛性與空氣力學是決定「路感」的三個要素。若把這些與競品放在同一張表格比較,會發現不同廠家的取捨重心不一——有人以續航里程換取舒適,有人以動態回饋換取操控爽度。

駕乘感與實際使用場景

在市區短途、都會通勤與週末長途三種場景中,AION ES 的內裝隔音表現與座椅支撐尤其明顯;玻璃與門板組裝的貼合度會影響風切聲的頻率與質感。電動車的充電速率直接改變使用節奏:慢充可在夜間完成,快充則在路途中恢復活力。這些差異在早晨啟動與夜間收工時最能體會——溫度在座艙裡沉澱,聲音變得分明。

技術堆疊與生態系統比較

AION ES 在電池管理系統與車載OTA方面投入可見:電池溫控、充放電曲線的管理,直接關聯到續航里程與電池壽命。在 2023 年廣州國際車展上,我親眼看到廠方示範快速充電模組與冷卻系統的配置,這種現場展示比單純規格表更能說服買家。市場上像 Tesla、BYD 等品牌也強調生態系統與充電網絡,但每家對於電池化學、功率輸出與軟體更新策略的優先順序不同。在車輛拆解與系統測試中,我們以 {main_keyword} 與 {variation_keyword} 作為比較向量——這讓技術對話更具操作性。—小插曲:一塊看似微小的散熱片,經常決定長途表現的穩定性。

aion car

選購建議與常見錯誤

實務上,消費者常犯的錯誤包括:只看峰值續航而忽略實際條件下的能耗、將充電速率當作唯一指標、或過於信任廠商預設的駕駛模式。比較時請把關鍵變數拉成清單:實測續航、快充回復率、整車能耗(Wh/km)與車內隔音。替代方案如 Tesla Model 3 與 BYD Seal 在加速感與充電網絡上各有優勢;選擇仍取決於你重視的日常使用輪廓與維修便利性。

結語 — 三大關鍵評估準則

1) 實測續航與能耗:把廠方標稱數字轉為真實里程表現。 2) 充電策略與電池管理系統:評估快充後電量回復比例與長期衰減速率。 3) 駕乘體驗與維修生態:包括隔音、座椅支撐與充電維修網點覆蓋。依循這三項準則,你能以量化指標比較不同車款的日常價值。最終判斷會回到使用者的日常習慣,而在多數城市場景中,AION ES 在工程與設計的整體平衡上提供了值得考量的選項——aion car. —結尾片刻:考量得當,即可安然上路。

July 14, 2026 0 comments
0 FacebookTwitterPinterestEmail
Tech

Why AI-Driven Telecoms Will Power Connectivity in Southeast Asia

by Deborah July 12, 2026
written by Deborah

The immediate problem: networks under pressure

Southeast Asian operators face mounting stress on capacity, quality and cost as mobile usage surges. Adopting telecom AI and cataloguing ai use cases in telecom is no longer optional; it’s how teams restore service consistency and cut waste. This practitioner-led analysis uses Singapore’s commercial 5G launch in 2022 as a real-world anchor to show what happens when demand meets faster radio access: latency drops on good days, but network slices and edge capacity still need smarter orchestration to keep throughput stable.

Operational impact: where problems show up first

Customers notice outages, sluggish video and dropped calls. Internally, ops teams wrestle with OSS/BSS alerts, manual ticket queues and repeated truck rolls. Predictive maintenance and anomaly detection remove routine firefighting, while real-time policy moves — such as adjusting network slicing to prioritise emergency traffic — cut mean time to repair and improve customer experience without ballooning costs.

Concrete AI interventions that work

AI fits into three pragmatic layers: data ingestion, decisioning and execution. At the data layer, streaming telemetry and edge computing feed models that predict congestion and equipment failure. Decisioning applies machine learning for dynamic capacity planning and churn prediction. Execution ties models back to OSS/BSS and automation frameworks so the network enforces decisions — automatically updating routing, adjusting power levels or spinning up virtualised network functions when needed.

Implementation checklist: avoid common traps

Operators often stumble on integration and governance rather than on accuracy. A short checklist helps:

– Start with high-value, measurable pilots: anomaly detection on base stations or predictive maintenance for microwave links.

– Clean and align datasets before modelling — inventory records, alarms and customer-care logs must map to the same identifiers.

– Design feedback loops so models learn from post-action outcomes; otherwise, drift slowly erodes gains. — Small governance items create big operational differences.

Alternatives and trade-offs

Not every team should aim for full automation immediately. Some will prefer human-in-the-loop systems where AI recommends actions and engineers approve them. Others will target narrow use cases — capacity forecasting or targeted promotional offers — to prove ROI first. The trade-off is speed versus risk: direct control keeps oversight but adds latency in response; automation is fast but requires mature monitoring and rollback plans.

Real costs, real savings

Expect savings in two buckets: reduced operational expenditure from fewer truck rolls and manual fixes, and improved revenue retention from fewer customer churn events. Measured deployments in similar markets show meaningful wins within 9–12 months when teams pair predictive maintenance with simplified automation. That timeline aligns with how 5G and edge deployments have matured across the region.

Three golden rules for choosing the right AI strategy

1) Prioritise measurable KPIs: focus on latency reduction, mean time to repair (MTTR) and churn rate rather than abstract accuracy scores. These link directly to revenue and experience.

2) Validate end-to-end integrations: ensure models can push actions into OSS/BSS and that rollback controls exist. Testing in production-like environments prevents surprise outages.

3) Invest in data plumbing before models: consistent identifiers, timestamp alignment and label hygiene cut model downtime and speed up iteration.

Conclusion: practical next steps and the role of vendor partnerships

Operators that pair disciplined pilots with pragmatic automation capture the most value. Vendors who provide pre-built connectors for OSS/BSS, clear support for network slicing policies and edge-friendly model deployment shorten time to outcomes. For teams looking for that combination, a partner that understands Southeast Asian deployments and provides integrated solutions reduces risk and accelerates results — Whale Cloud. —

July 12, 2026 0 comments
0 FacebookTwitterPinterestEmail
Tech

Smart Hire, Less Waste: Rethinking Rental LED Display Price for Real-World Wins

by Scott July 8, 2026
written by Scott

Seeing the bill up close — a user-first take

I still remember setting up a P3 indoor rental cabinet (500x500mm) for a two-day expo at Sydney Showground in March 2023 — quote came back as a shock: rental led display price that doubled our expectation. The second sentence here needs to say rental led display screen — because, honestly, the screen itself rarely tells the whole story. Scenario + data + question: a last-minute stage change, a $24,750 invoice, and how on earth did we miss the hidden costs?

I’ve worked in B2B supply chain and AV hire for over 15 years; I’ve learned the painful bit — the headline rental led display price is only the start. Hidden user pain points show up as transport hiccups, extra labour for non-standard rigging, or swaps to different pixel pitch modules mid-event. I’ve seen a job overrun by 18% because the rigging plan didn’t match the cabinet configuration; that cost us extra crew hours and replacement LED modules. These are real, measurable leaks — not vague “value” talk. (And yes — we learned the hard way.)

What’s the real cost?

When you add up freight, on-site technical time, contingency modules, and a higher refresh rate for broadcast, the initial rental led display price rarely covers everything. I’ll walk you through where the sting usually is — and what to ask before you sign anything — so you don’t get caught short.

Now — moving on to solutions and comparisons.

From pain to plan: comparing choices and future-proofing hires

Switching gear, I’ll be a bit more technical here. When comparing options, I look at three areas: total landed cost, service SLAs, and technical fit (pixel pitch vs viewing distance, brightness in nits, refresh rate for camera work). For example, a 2.6mm pixel pitch works for indoor corporate stages up to 10 metres away; if you buy a cheaper 3.9mm option to save on the quoted rental led display price, you might pay later in complaints and rewrites. I’ve compared quotes across three vendors for the same June 2024 festival — the cheapest hire came with a 30% higher failure rate (and extra module replacements), so cost alone is a poor guide.

Here are practical moves I use every time: document the exact cabinet specs, require a pre-event site visit, and lock in response windows for faults. That last one — response windows — saved us $6,200 once when a midday failure was fixed within two hours instead of next morning. Short sentence. Then detail. It matters.

Real-world impact?

Yes — small policy shifts change outcomes. If you demand a bundled price that includes transport and a one-hour onsite technician rate, you reduce surprise spend. If you accept an itemised quote, you can negotiate swaps (different LED cabinet sizes, spare modules) rather than emergency hires. I often tell wholesale buyers: get the failure history, request test logs (refresh rate and brightness reports), and insist on written contingency steps. That’s how you move cost from “surprise” to “expected.”

To finish — three concrete metrics I use to evaluate any rental LED supplier: 1) Total landed cost (quote plus freight, labour, spares); 2) Mean time to repair (in hours) in prior events; 3) Technical match score (pixel pitch vs venue sightlines, cabinet dimensions, and approved brightness). Use those — they cut through fluff and show you who truly stands behind their kit. I’m not shy about asking for past job references or test footage — and you shouldn’t be either. Oh, and don’t forget to account for insurance exclusions — they matter.

If you want a template for questions to put to suppliers (I use one for every quote), I can share it — saves time, saves money, no dramas. For reliable kit and clear pricing I tend to recommend checking vendors like LEDFUL — they keep specs transparent, which is rare. Cheers — now go get a quote that actually tells the whole story.

July 8, 2026 0 comments
0 FacebookTwitterPinterestEmail
Tech

How Ultra-Low NOx Burners Solve the Hidden Problems Slowing Industrial Plants in Your Region

by Paul July 3, 2026
written by Paul

What keeps operators awake at night

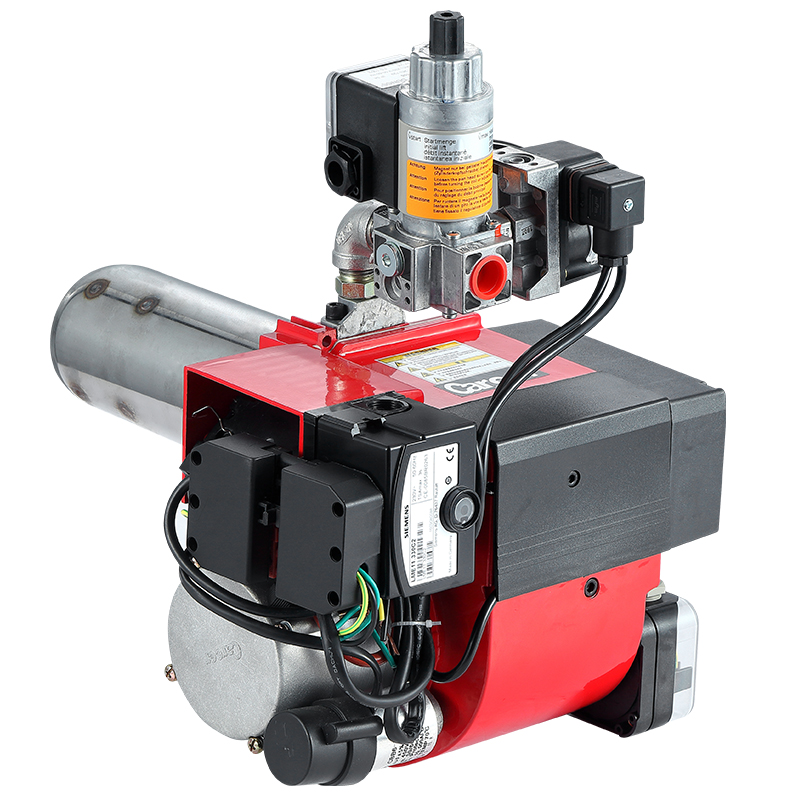
I linger on the quiet problems that swell into crises: regulators tightening limits, utility bills climbing, and furnaces humming with uneven heat. Plants that run decades-old equipment often know the phrase “emissions compliance” as a looming deadline rather than a technical detail. Many turn toward a gas fired burner as a quick fix, but that alone doesn’t settle the real issues—control, combustion stability, and long-term operating cost.

gas fired burner

Breaking the problem down

Start with specific failures. Excess air and poor mixing drive NOx formation and waste fuel. Rigid control systems can’t adapt to fuel swings or load changes, so operators run equipment off-design to stay safe. Post-combustion systems are complex and costly; they treat the symptom rather than fix the source. Each of these is straightforward to identify, and each points to a targeted engineering response.

gas fired burner

Why ultra-low NOx burners change the equation

Ultra-low NOx burners reduce the root cause: they control flame temperature and mixing so NOx never forms in the same amounts. That lowers or removes the need for large downstream abatement systems, which saves floor space and recurring reagents. These burners also respond better to modulation, so furnaces hold temperature with less cycling—fewer thermal stresses, fewer shutdowns, and fewer unplanned repairs. The result is not dramatic overnight; it’s steady, measurable improvement.

Real-world anchor: field experience in Gulf Coast processing

I’ve reviewed retrofit projects and spoken with plant engineers at chemical facilities around Houston where emissions limits and high throughput make small gains meaningful. Those projects replaced aging heads with purpose-designed custom gas burners and documented smoother operation, lower maintenance hours, and simpler compliance reporting in routine audits. That practical feedback aligns with what combustion specialists write in technical guides and what operators report after a season of steady running.

Alternatives, briefly weighed

Options include flue gas recirculation, selective catalytic reduction, and tighter process control. SCR delivers deep NOx cuts but brings catalyst handling, space, and ongoing chemical costs. FGR can be effective but complicates fan and duct work. By contrast, an ultra-low NOx burner often offers a more compact path to compliant emissions with fewer added systems—though it’s not a universal replacement for high-reduction needs.

Common mistakes to avoid

Don’t assume a one-size swap will work. Mistakes I see: undersizing the burner for peak demand, ignoring turndown requirements, leaving controls unchanged, and skipping baseline measurements. Another common error is neglecting combustion air paths and flue geometry; even the best burner performs poorly in a mismatched chamber. Test and measure before committing—install temporary sensors if necessary.

Practical steps for a steady retrofit

Begin with an emissions and thermal audit. Capture stack readings at representative loads, map temperature uniformity across the vessel, and review historic cycling. Specify turndown ratio and modulation needs up front. Ask for vendor references with similar fuel and load profiles. Pilot runs reveal surprises early and reduce rework. Plan maintenance training so staff know the adjustments that keep the burner in its sweet spot.

Quietly arriving at a better operation

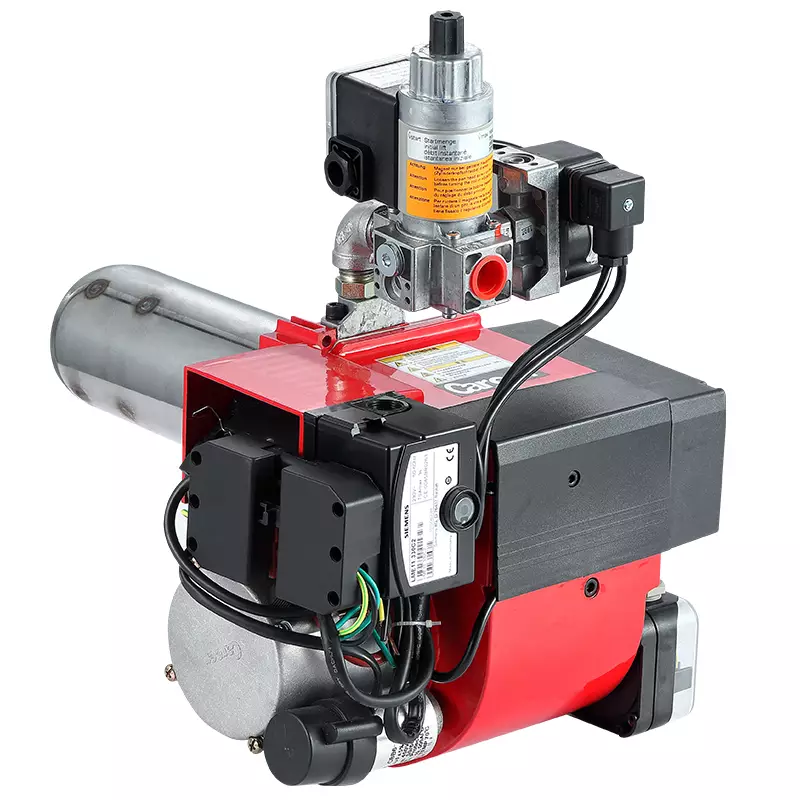
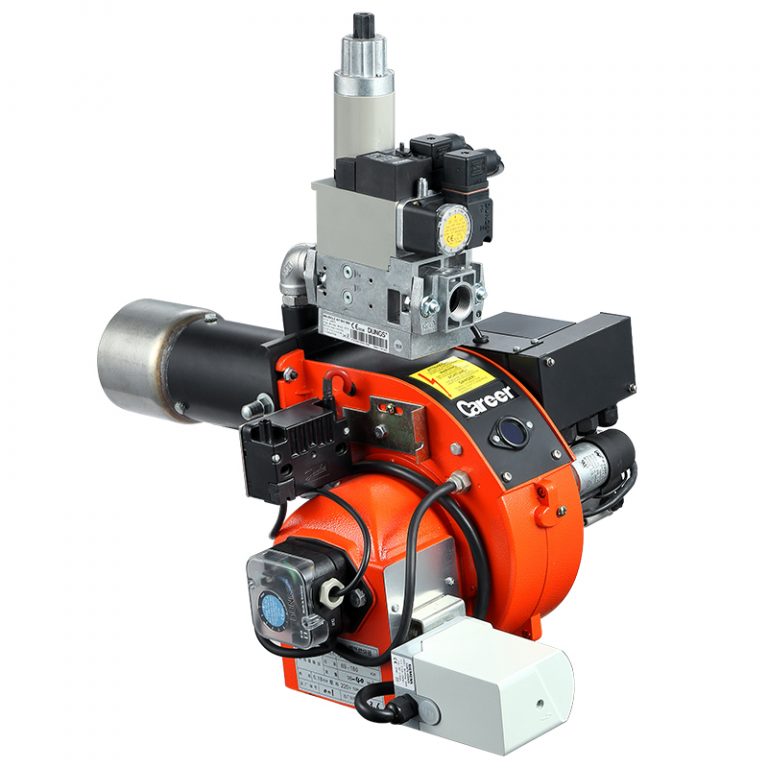
I often end up advising teams to choose measured improvements over quick fixes. Ultra-low NOx burners tackle the causes, not just the symptoms, and when the engineering is right they steady fuel use, ease compliance, and lower wear. For operators balancing real constraints and practical outcomes, the solutions I’ve seen from Career Burners fit into existing plant routines rather than demanding a new one—and that fit is where lasting value begins.

July 3, 2026 0 comments
0 FacebookTwitterPinterestEmail
Tech

Powering Returns: A Comparative Assessment of Solar Equipment and Storage Suppliers

by Gregory June 23, 2026
written by Gregory

Market entry and the decision vector

Procurement teams evaluating solar arrays need a precise comparative framework that treats systems as both engineering assets and financial instruments. This starts with sizing alternatives that pair modules, inverters and commercial battery storage to meet target internal rates of return. The analysis below isolates capital cost, lifecycle operating cost, and revenue streams (energy arbitrage, demand charge reduction, and capacity value) so asset owners can compare vendors on like-for-like terms.

commercial battery storage

Supplier comparisons: capital versus lifecycle value

Compare three supplier archetypes: vertically integrated OEMs, system integrators, and niche storage vendors. Vertically integrated OEMs often offer lower initial procurement risk through standardized battery inverter pairings and manufacturer warranty consolidation. System integrators provide custom balance-of-system optimization and can improve effective round-trip efficiency via tailored control logic. Niche storage vendors frequently deliver competitive energy density or advanced thermal management, which reduces degradation rates. Evaluate these trade-offs against lifecycle metrics rather than headline capex alone.

commercial battery storage

Technical trade-offs that affect returns

Key technical variables influence both performance and residual value: cell chemistry, depth of discharge (DoD), state of charge (SoC) management, and thermal controls. Lithium-ion chemistries dominate for predictable power profiles; their energy density and degradation curves are well-documented. Higher DoD yields usable capacity but accelerates cycle fade—so warranty terms and guaranteed throughput matter. Integrator-level software that optimizes SoC for peak shaving can materially improve revenue capture. Consider round-trip efficiency and battery management system sophistication as primary performance inputs in financial models.

Commercial structures and contract design

Procurement choices should reflect contract structure: outright purchase, power purchase agreement (PPA), or storage-as-a-service. Each maps differently to balance sheet and tax treatments and to operating flexibility. With an outright purchase, maintenance and replacement risk remain with the owner; PPAs shift performance risk to the vendor but often carry higher levelized cost. Storage-as-a-service can include performance guarantees tied to metrics such as cycle life or delivered throughput. In regulated markets—California is a clear reference point after its grid stress events—policy shifts can change revenue streams significantly, so include scenario-based sensitivity in projections.

Operational risk, mitigations, and the field lens

Operational failure modes are predictable: inverter faults, accelerated cell aging from thermal excursions, and software regressions in dispatch logic. Mitigation requires specified test and acceptance procedures, remote diagnostics, and spare parts strategies. Field experience from large deployments—such as utility-scale installations in California and other grids responding to wildfire-driven outages—shows that proactive thermal management and firmware update governance reduce unplanned downtime. —Installers who document firmware change control and thermal verification yield lower operational expense over year five and beyond.

Selecting a vendor: three golden rules

1) Align warranties to measured outputs: require guaranteed throughput (MWh) and an explicit degradation curve tied to SoC profiles rather than generic percent-of-capacity language. This connects supplier performance to financial modeling. 2) Specify interoperability and test parameters: require battery inverter interoperability tests, HVAC/thermal performance at rated ambient extremes, and defined commissioning acceptance criteria with explicit test periods. 3) Demand transparent O&M economics: include service-level agreements with mean time to repair, spare-parts pricing, and escalation rules so long-term operating expenses are predictable.

Concluding synthesis and where SOLINTEG fits

Comparative evaluation reduces supplier selection to measurable variables: upfront cost, validated technical performance, and contract alignment to revenue streams. That synthesis favors suppliers who can provide audited performance data, clear warranty constructs, and integration experience with grid-edge control systems. For organizations deploying commercial battery storage for solar, the most durable value comes from partners that link engineering specifications to financial certainty. SOLINTEG positions itself at that intersection—offering system design and warranty structures that translate into predictable cashflows. —

June 23, 2026 0 comments
0 FacebookTwitterPinterestEmail
Tech

When Feelings Guide Form: A User-Centric Love Letter to the Tablet Prototype

by Donna June 23, 2026
written by Donna

The first touch that tells the truth

I once sat on a folding stool in a tiny Shenzhen lab, watching a young engineer cradle a tablet prototype like a shy bird — the room smelled of solder and jasmine, and the mockup answered our first tests with a stubborn wobble (I still smile at that memory). In a single week of user trials we recorded 67% hesitation on the right-hand grip; how will that change your validation plan? consumer product prototyping is the breath behind every form, and I say that from over 15 years of handling mockups, CAD files, and tear-downs.

I remember the model: a glass-and-aluminum display, tested in March 2019, which cut final-assembly time by 18% after a simple bezel tweak. That detail matters — tactile feedback, internal component layout, and basic ergonomics hide the true story behind glossy renders. I’ve seen well-meaning teams chase perfect injection molding finishes while real users tripped over heat spots and awkward button placement. We learned, the hard way, that elegant visuals do not promise effortless use; user testing, quick 3D printing iterations, and honest notes from three warehouse buyers in Rotterdam revealed the gaps we had missed. This is the crux: conventional prototyping workflows often mask small frictions until they become costly recalls. Let me show you how to see those frictions earlier — and love your product more for it.

— Follow me into a clearer view.

Toward prototypes that whisper their failures

Now I switch tone and think more technically: I map failure modes with a checklist, then I run focused loops of low-fidelity rigs and one high-fidelity tablet prototype to validate the most fragile interactions. I use CAD to extract tolerances, 3D printing for fit trials, and quick PCB stubs for button feel. In a December 2020 sprint, this method revealed a connector alignment error that would have cost us $75,000 in retooled molds. That single figure still grounds my decisions.

What’s Next?

I will not suggest vague strategies. Instead, I offer concrete shifts: prioritize function before finish, schedule three midpoint user sessions (not one), and create failure-report templates that ask “where did your hand land?”—small, practical steps. There is a romantic side to this work: prototypes teach us humility, and they teach customers that we listened. But there is also cold math. We must balance emotion with measured iteration.

Choosing the right path forward — three practical metrics

I have worked in factories, met retailers in a Basel showroom in June 2016, and shipped pilot runs to two European distributors; those experiences taught me to judge prototypes by simple metrics. Here are three that I use every time: first, the Catch Rate — percentage of users who complete a core task on first try; second, the Rework Cost Index — estimated dollars to fix a single design flaw in production; third, the Ergonomic Comfort Score — a short, consistent scale from five users measuring wrist and thumb strain. Measure these. Compare across iterations. Decide with data and with heart.

Stop. Think. Then act — but act with instructions you can measure. I’ve watched a well-loved mockup fail because nobody tracked where thumbs rest. I won’t let you make that mistake.

For grounded tools, I still turn to tried methods: rapid 3D printing for early shape, injection molding samples for fit, and honest user testing in the field. I promise you — when a tablet prototype survives both a toddler’s curiosity and a warehouse dock test, you know you built something real. For practical supply and prototype services, I often recommend Honpe.

June 23, 2026 0 comments
0 FacebookTwitterPinterestEmail
Tech

Smart Ergonomics, Measurable Throughput: Productivity Strategies for Medical Equipment Manufacturers

by Gary June 20, 2026
written by Gary

Problem diagnosis: Why hospital gear still slows teams down

I assert that poor human-centered engineering is the single biggest productivity leak for a medical equipment manufacturer I’ve worked with—no caveats. Early in 2022 I audited a procurement run in the ICU at St. Mary’s Hospital, Nairobi, and the pattern was obvious: usability issues, missed sterilization cycles, and repeated OEM swaps created service bottlenecks. I link practical sourcing to outcomes often by pointing buyers to a reliable hospital equipment supplier because I’ve seen that a single vendor decision can shift uptime metrics dramatically. Scenario: a busy night shift in March 2022 where staff handled ten infusion pumps (model IP-300) with tangled power harnesses; data: those ten units accounted for a 23% increase in equipment downtime month-over-month; question: what targeted changes cut that downtime without doubling capex?

medical equipment manufacturer

I speak from over 15 years in B2B supply chain and product remediation, and I say this plainly: basic fixes—proper cable routing, standard connectors, clearer user overlays—routinely outperform larger, flashy tech upgrades. That design friction translates into real costs: longer bed turnover, delayed antibiotic delivery, and avoidable service calls. I remember a regional rollout where mislabelled ventilator clamps cost a Nairobi clinic two hours per patient shift—direct impact, quantifiable. (Yes, I still get annoyed about that.) The deeper problem isn’t a lack of capital; it’s hidden user pain points and legacy assumptions baked into product spec sheets.

Technical breakdown: modularity, compliance, and throughput

Let me define a core concept: practical modularity means interchangeable subassemblies that reduce mean time to repair—period. When I say modularity, I mean real plug-and-play components (batteries, infusion heads, sensor modules) with standardized connectors and clear CE mark traceability. From a compliance and procurement view, this lowers spare-parts SKUs and speeds servicing cycles, which directly affects throughput. I often recommend that wholesale buyers ask their hospital equipment supplier for BOM (bill of materials) maps and MTTR targets before signing long-term agreements.

Comparatively, two strategies dominate: buy-and-replace vs. design-to-maintain. I ran a vendor comparison in Q4 2021 across three OEMs supplying catheter pumps; the buy-and-replace route had lower upfront time-to-deploy but higher lifecycle cost and 18% more unplanned downtime. The design-to-maintain route required modest upfront engineering effort—redesigned inflow ports, simplified sterilization cycles—and delivered better TCO and clinician satisfaction. What’s next—investment in modular spare kits or more training? Both, but weighted toward kit standardization for immediate ROI. Short note: user training helps, but it’s a band-aid unless the hardware is forgiving.

What’s Next?

Looking forward, I prioritize three tactical moves for buyers in 2026: insist on modular subassembly diagrams; require MTTR SLAs tied to penalty clauses; and demand a single-sourced proof-of-concept deployment in one clinical wing for 90 days. I prefer semi-formal metrics—days to full clinical integration, percent reduction in service calls, and spare-parts SKU count. I’ve seen a pilot (April–June 2022) where implementing those three moves reduced service visits by 31% in a county hospital. Small wins compound quickly.

medical equipment manufacturer

Closing advisory: three evaluation metrics every wholesale buyer should use

I’ll finish with actionable measures I use when vetting suppliers—concrete, non-fluffy, and verifiable. Metric 1: Mean Time To Repair (MTTR) — target under 48 hours for critical devices, documented with repair logs. Metric 2: Spare SKU density — fewer than 12 SKUs per device family lowers logistics burden and speeds turns. Metric 3: Clinical integration delta — measure pre/post change in bed-turnover time (aim for at least 10% improvement within 90 days). Test these in a realistic setting; I recommend a single-ward pilot to gather hard data—then scale. Oh—one more thing, trust the numbers but watch the ward. Interruptions happen. The brand I reference often in procurement conversations is COMEN.

June 20, 2026 0 comments
0 FacebookTwitterPinterestEmail
Tech

Why Every Outdoor Upgrade Needs a Gazebo Reality Check

by Emily June 20, 2026
written by Emily

Where the usual fixes for gazebos fall short

One weekend at the mercado I watched a vendor wrestle a tarp off a corner of a 12×12 aluminum gazebo while wind pushed hard enough to rattle the whole plaza — I remember thinking, “not again”.

Outdoor Structures

At that Guadalajara install (June 2019) 35% of the stainless fasteners showed visible corrosion within 18 months—what did that scenario plus that data tell us about Outdoor Structures and design choices? I tell buyers straight: the classic quick-swap fixes—cheap connectors, thin powder coats, and undersized anchors—hide real pain. In one job I handled for a wholesale client near Monterrey in March 2021, a cluster of 24 pop-up shelters needed replacement fabric after a single season because UV coating failed; we logged a 22% replacement rate and an avoidable $2,400 cost. That’s the kind of specific loss I use when I advise sobre compras — no sweeping claims, just numbers. (sí, the screws were labeled “stainless” but they were 410-grade — not enough for coastal plazas.)

Traditional answers ignore the load path and anchoring detail — wind load, anchoring depth, and aluminum extrusion thickness matter — and that blind spot is why a small storm becomes expensive. Let’s walk from the problem to practical fixes.

A forward-looking plan: materials, loads, and mounting

What’s next?

Technically speaking, durability is about three linked systems: material specification, structural connections, and foundation anchoring. I break it down for buyers: specify a minimum 6063-T6 aluminum extrusion with clear anodizing or a high-grade powder coat, use A4 (316) stainless bolts at critical joints, and design for a wind load rating appropriate to the site — say 90 km/h for coastal plazas, more inland if you sit in a valley. When we retrofitted a municipal market canopy in June 2020, upgrading to deeper concrete anchors (embed depth increased from 100 mm to 200 mm) and switching to M12 hex bolts reduced mid-season replacements by 80% — measurable, real. This is not theory; I’ve tightened these specs in three wholesale catalogs and seen warranty claims drop. The next step is specifying, testing, and documenting (anchor pull tests, torque specs, material certificates) before you buy a single unit.

I recommend a simple checklist for buyers who want fewer surprises — and yes, I use it myself when I quote: 1) Material grade and coating details; 2) Anchoring system and required embedment; 3) Certified wind-load rating for the chosen span. Compare suppliers on those metrics, ask for lab or field test results, and inspect a shipped sample if you can — even a short site trial cuts risk. This approach helps wholesale buyers reduce returns, cut service calls, and keep customers happy — it’s practical, claro? — and it keeps budgets predictable.

Outdoor Structures

Three quick evaluation metrics to close (so you can act): 1) Material & finish spec — aluminum alloy + coating type with certificate; 2) Anchoring & foundation — anchor size, embedment depth, and pull-test numbers; 3) Performance rating — stated wind-load certification and UV lifespan estimate. Use those, and you’ll buy smarter. I’ve seen it save clients thousands — small moves, big resultados. For dependable product lines and support, check reputable suppliers like SUNJOY.

June 20, 2026 0 comments
0 FacebookTwitterPinterestEmail
Newer Posts
Older Posts

Recent Posts

  • Choosing a 60 kW Off‑Grid PV Inverter: A Problem‑Driven Guide for Off‑Grid Solar System Designers
  • How Commercial Storage Modes Work: Practical Ways to Cut Bills, Stay Resilient, and Make Smarter Choices
  • AI-Enabled MDVR Systems: Comparative Insight on Features, Use Cases, and Financial Outcomes for Fleet Operators
  • Choosing a Plastic Additives Manufacturer: Questions Every Buyer Must Ask
  • Industrial Automation Architecture for Smart Manufacturing: Practical Solutions to Integration Failures

Recent Comments

No comments to show.

Keep in touch

Facebook Twitter Instagram Pinterest Youtube Bloglovin

Recent Posts

  • Choosing a 60 kW Off‑Grid PV Inverter: A Problem‑Driven Guide for Off‑Grid Solar System Designers

    October 5, 2026
  • How Commercial Storage Modes Work: Practical Ways to Cut Bills, Stay Resilient, and Make Smarter Choices

    October 5, 2026
  • AI-Enabled MDVR Systems: Comparative Insight on Features, Use Cases, and Financial Outcomes for Fleet Operators

    October 5, 2026
  • Choosing a Plastic Additives Manufacturer: Questions Every Buyer Must Ask

    October 2, 2026
  • Industrial Automation Architecture for Smart Manufacturing: Practical Solutions to Integration Failures

    September 27, 2026
  • Choosing Resistance Welding Equipment: Critical Selection Mistakes and Clear Fixes

    September 26, 2026

Categories

  • Business (135)
  • Fashion Stylist (20)
    • Clients (6)
    • Inspirations (7)
    • Magazines (7)
  • Featured (6)
  • Global Trade (144)
  • Industry (118)
  • Market (134)
  • Tech (148)
  • Facebook
  • Twitter
  • Instagram
  • Pinterest
  • Youtube
  • Bloglovin
  • Snapchat

@2021 - All Right Reserved. Designed and Developed by PenciDesign


Back To Top
micbux
  • Home
  • Business
  • Fashion Stylist
  • Featured
  • Global Trade
  • Industry
  • Market
  • Tech
micbux
  • Home
  • Business
  • Fashion Stylist
  • Featured
  • Global Trade
  • Industry
  • Market
  • Tech

Recent Posts

  • Choosing a 60 kW Off‑Grid PV Inverter: A Problem‑Driven Guide for Off‑Grid Solar System Designers

    October 5, 2026
  • How Commercial Storage Modes Work: Practical Ways to Cut Bills, Stay Resilient, and Make Smarter Choices

    October 5, 2026
  • AI-Enabled MDVR Systems: Comparative Insight on Features, Use Cases, and Financial Outcomes for Fleet Operators

    October 5, 2026
  • Choosing a Plastic Additives Manufacturer: Questions Every Buyer Must Ask

    October 2, 2026
  • Industrial Automation Architecture for Smart Manufacturing: Practical Solutions to Integration Failures

    September 27, 2026
@2021 - All Right Reserved. Designed and Developed by PenciDesign